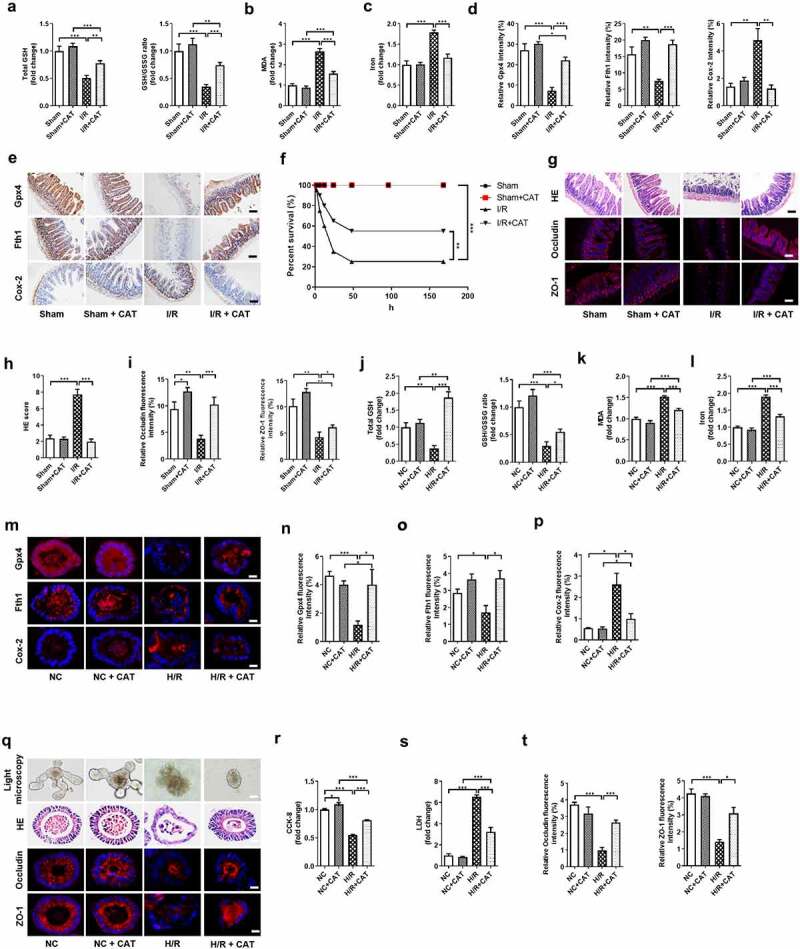
Figure 4.

CAT inhibits intestinal I/R-induced ferroptosis. (a) The total GSH and GSH/GSSG levels in the intestinal tissue. (b-c) MDA and Fe2+ levels in the intestinal tissue. (d) Relative quantitative statistics of Gpx4, Fth1 and Cox-2 protein expression. (e) The protein levels of glutathione Gpx4, Fth1 and Cox-2, scale bar is 100 μm. (f) 7-day survival rate of mice after intestinal I/R, n = 20. (g) HE staining of small intestine tissue and the relative protein levels of Occludin and ZO-1, scale bar is 100 μm. (h) Chiu’s pathology score. (i) Relative fluorescence quantitative statistics of Occludin and ZO-1 protein expression. (j) Total GSH and the ratio of total GSH/GSSG in the organoids. (k-l) MDA and Fe2+ levels in the organoids. (m) The protein levels of Gpx4, Fth1 and Cox-2 in the organoids, scale bar is 20 μm. (n-p) Relative fluorescence quantitative statistics of Gpx4, Fth1 and Cox-2 protein expression. (q) Ileum organoid morphology observed by light microscopy and HE staining and the expression of Occludin and ZO-1 in the organoids observed by immunofluorescence, scale bar is 20 μm. (r) Organoid viability measured by CCK-8. (s) LDH released into the medium. (t) Relative fluorescence quantitative statistics of Occludin and ZO-1 protein expression in the organoids. The results are expressed as the mean ± SEM. n = 8 in vivo; n = 6 in vitro. * p < .05, ** p < .01, *** p < .001 by one-way ANOVA (Tukey’s test)
