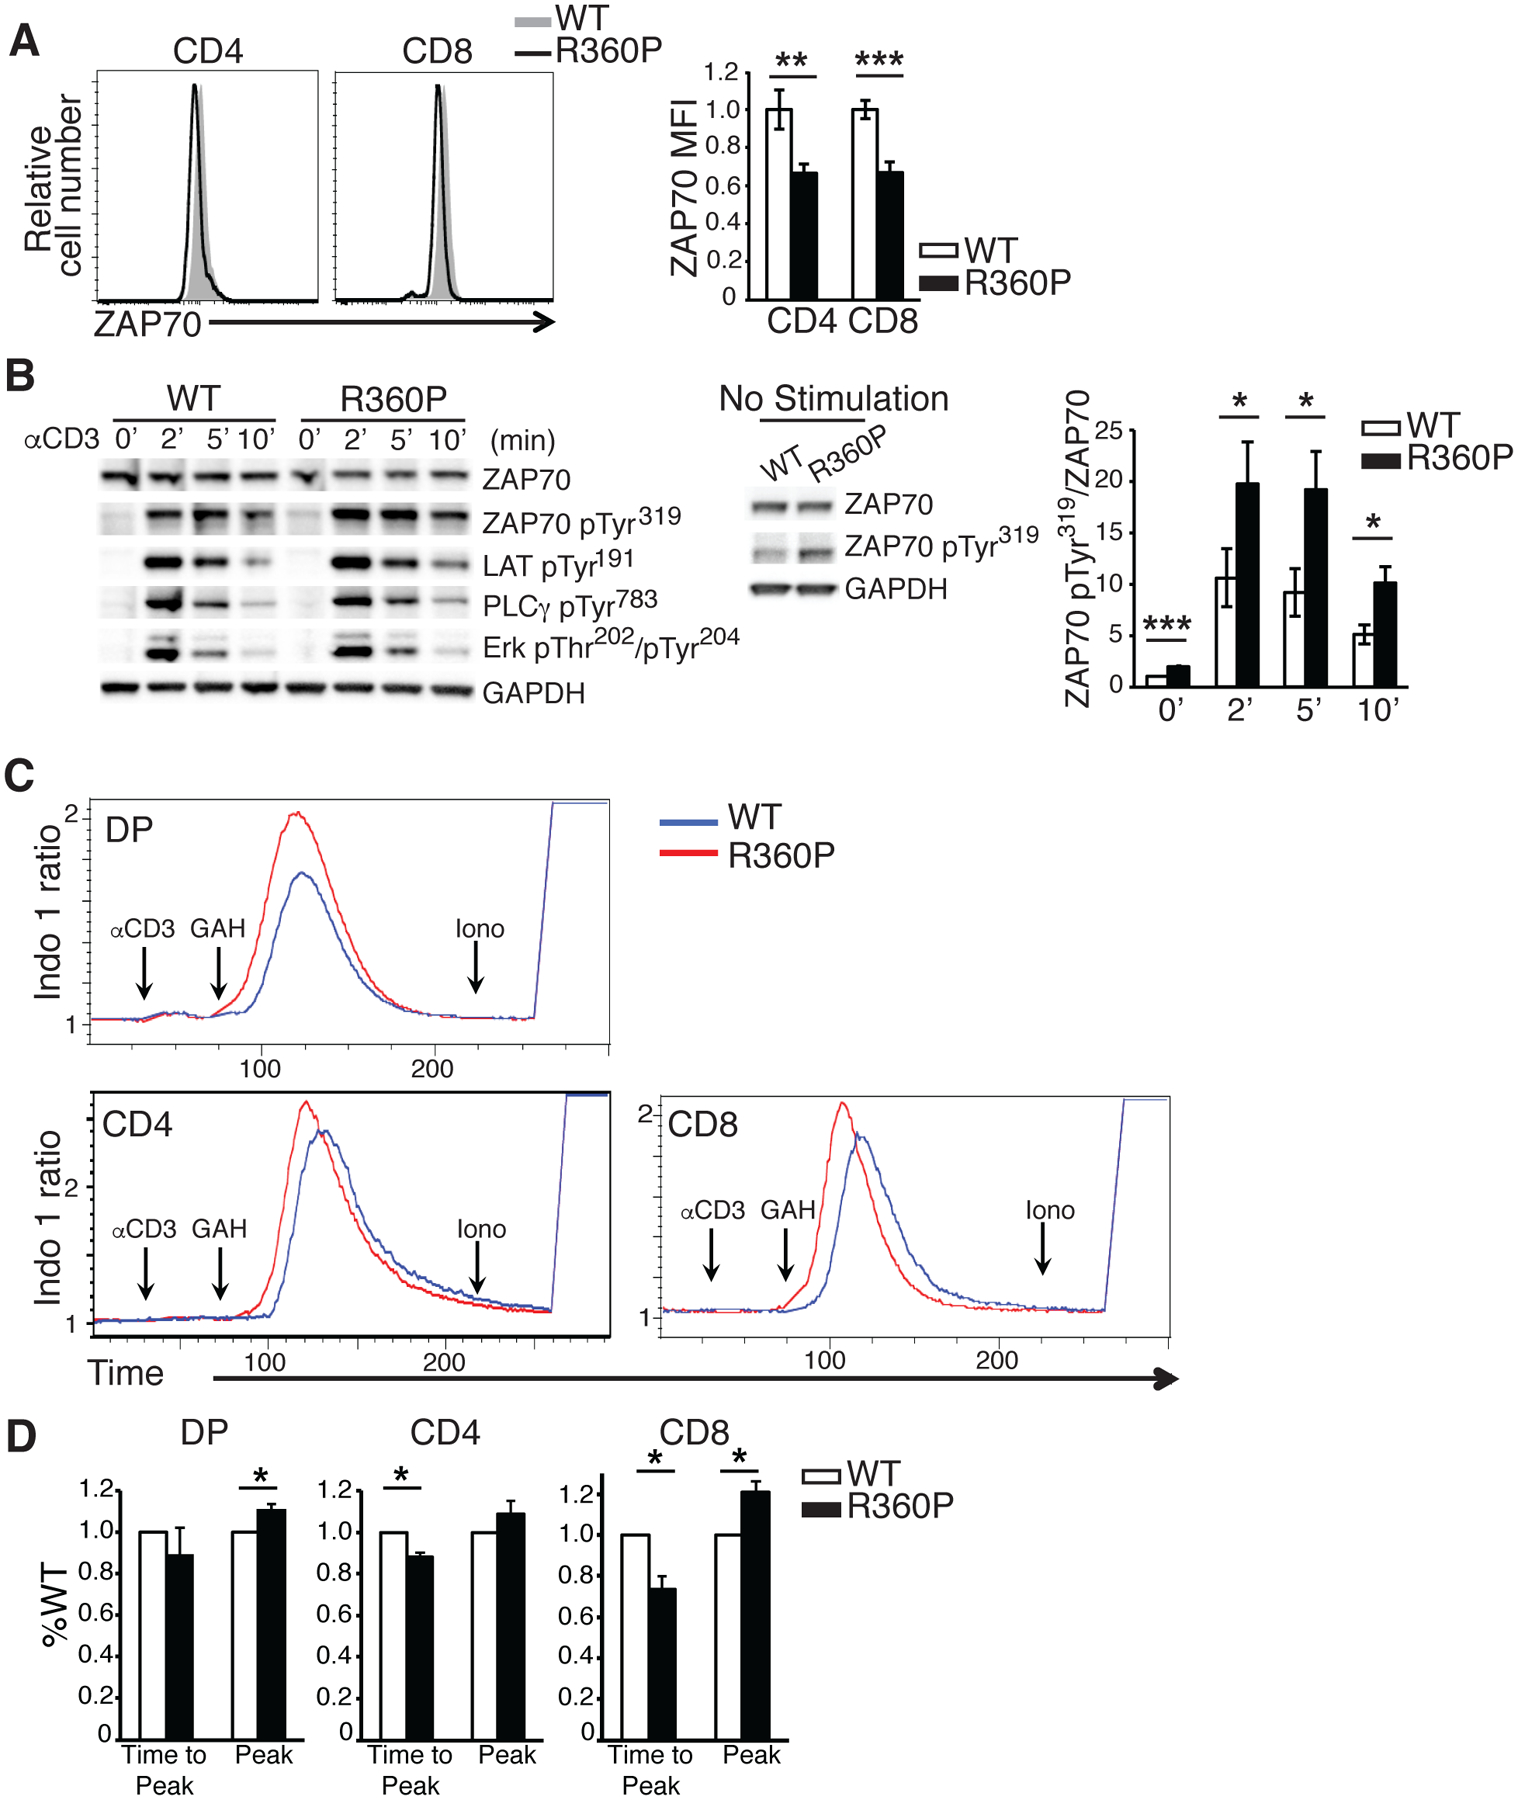
Figure 3. Effect of ZAP70 R360P mutation on T cell development and TCR signaling.

(A) ZAP70 amounts in peripheral CD4+ or CD8+ T cells from WT or R360P mice are shown. Error bars represent SD (n = 4 mice for WT, n = 3 mice for R360P). Data are representative of three independent experiments. Unpaired student’s t-test was used for statistical analysis. (B) Thymocytes from WT or R360P mice were stimulated with anti-CD3 (2C11) antibody (10μg/ml) for the indicated times. Immunoblots of whole cell lysates with antibodies as labeled are shown on the left. The middle panel shows immunoblots of whole cell lysates of WT or R360P thymocytes at the basal state with antibodies as labeled. A long exposure was done for ZAP70-pTyr319. The ratios of band density of ZAP70-pTyr319 standardized by total ZAP70 amounts from the above immunoblot analyses are shown on the right. Data are summarized from three independent experiments. Error bars represent SEM. Paired student’s t-test was used for statistical analysis. GAPDH, glyceraldehyde-3-phosphate Dehydrogenase. (C) Ca2+ influx in double positive (DP) thymocytes, peripheral CD4+ or CD8+ T cells from WT or R360P mice following TCR stimulation with anti-CD3 (2C11) (10μg/ml) and crosslinking with goat anti-Armenian hamster IgG (GAH) (50μg/ml); Iono: Ionomycin. (D) Bar graph showing the average peaks of Ca2+ influx (labeled as “peak”), as well as time taken to reach Ca2+ influx peak (labeled as “time to peak”) from the time when GAH was added in DP thymocytes, peripheral CD4+ or CD8+ T cells. Data were standardized by the WT controls. Quantified data are summarized from three independent experiments. Error bars represent SD. Paired student’s t-test were used for statistical analysis. * P < 0.05, ** P < 0.01, *** P< 0.001.
