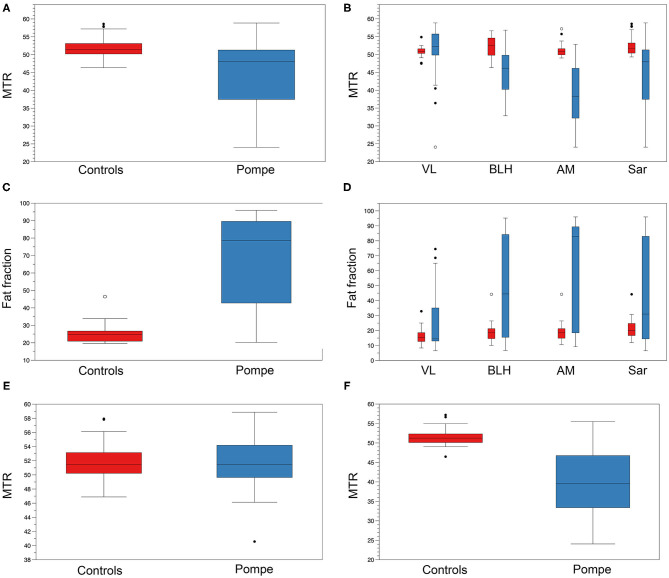
Figure 3.
MTR and FF in controls and Pompe patients. (A) Mean thigh MTR value in controls (red) and Pompe patients (blue). (B) MTR value of VL, BLH, AM, and Sar in controls (red) and Pompe patients (blue). (C) Mean thigh FF value in controls (red) and Pompe patients (blue). (D) FF of VL, BLH, AM, and Sar in controls (red) and Pompe patients (blue). (E) Mean thigh MTR value in individuals with mean thigh FF lower than 20% in controls (red) and Pompe patients (blue). (F) Mean thigh MTR value in individuals with mean thigh FF higher than 20% in controls (red) and Pompe patients (blue). Mean value and standard deviation are shown.

