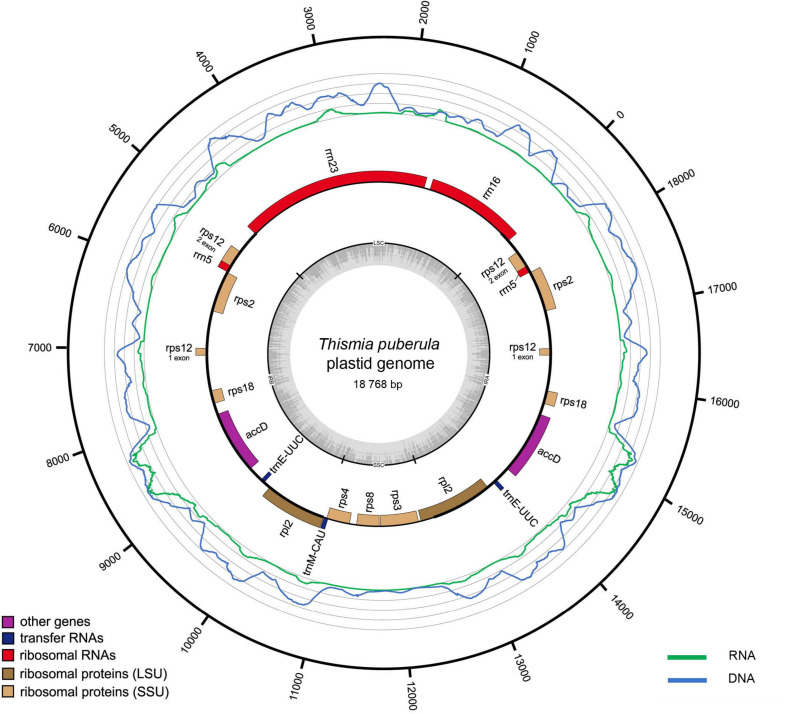
FIGURE 1.
Plastid genome of Thismia puberula, its GC-content, gene expression and coverage by genomic DNA sequencing reads. This species has the largest gene set and was available as a living plant allowing to analyze the transcriptome. Dark gray dashes denote GC content; thick black lines denote IR and thinner lines denote single copy regions. Genes shown outside of the circle are transcribed counterclockwise and those inside are transcribed clockwise. Green and blue lines show coverage by transcriptome reads and genomic DNA reads. Gray circles correspond to a 1000x coverage for transcriptome and 2000x for DNA.

