
. 2020 Aug 20;36(Suppl 1):S151–S159. doi: 10.3904/kjim.2019.435
Copyright © 2021 The Korean Association of Internal Medicine
This is an Open Access article distributed under the terms of the Creative Commons Attribution Non-Commercial License (http://creativecommons.org/licenses/by-nc/4.0/) which permits unrestricted noncommercial use, distribution, and reproduction in any medium, provided the original work is properly cited.
Figure 1.
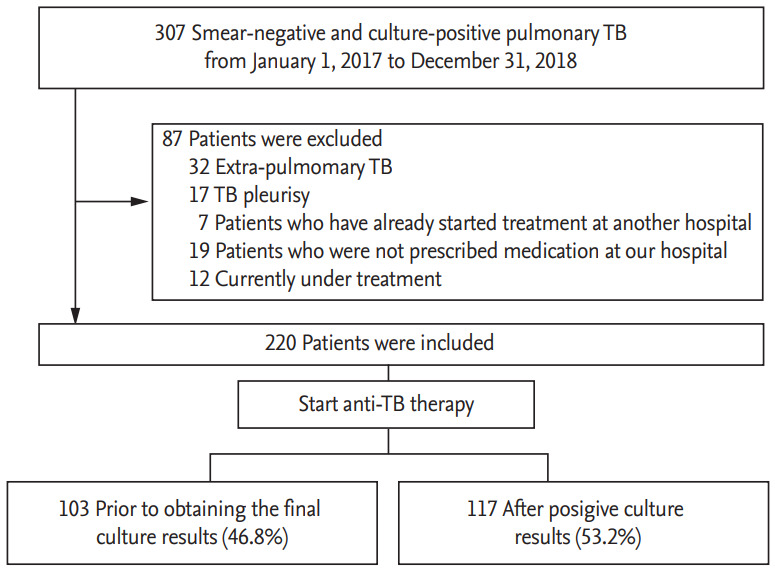
Flow chart of the study population. TB, tuberculosis.