
Extended Data Fig. 5. Robustness and reproducibility of DI-SPA.
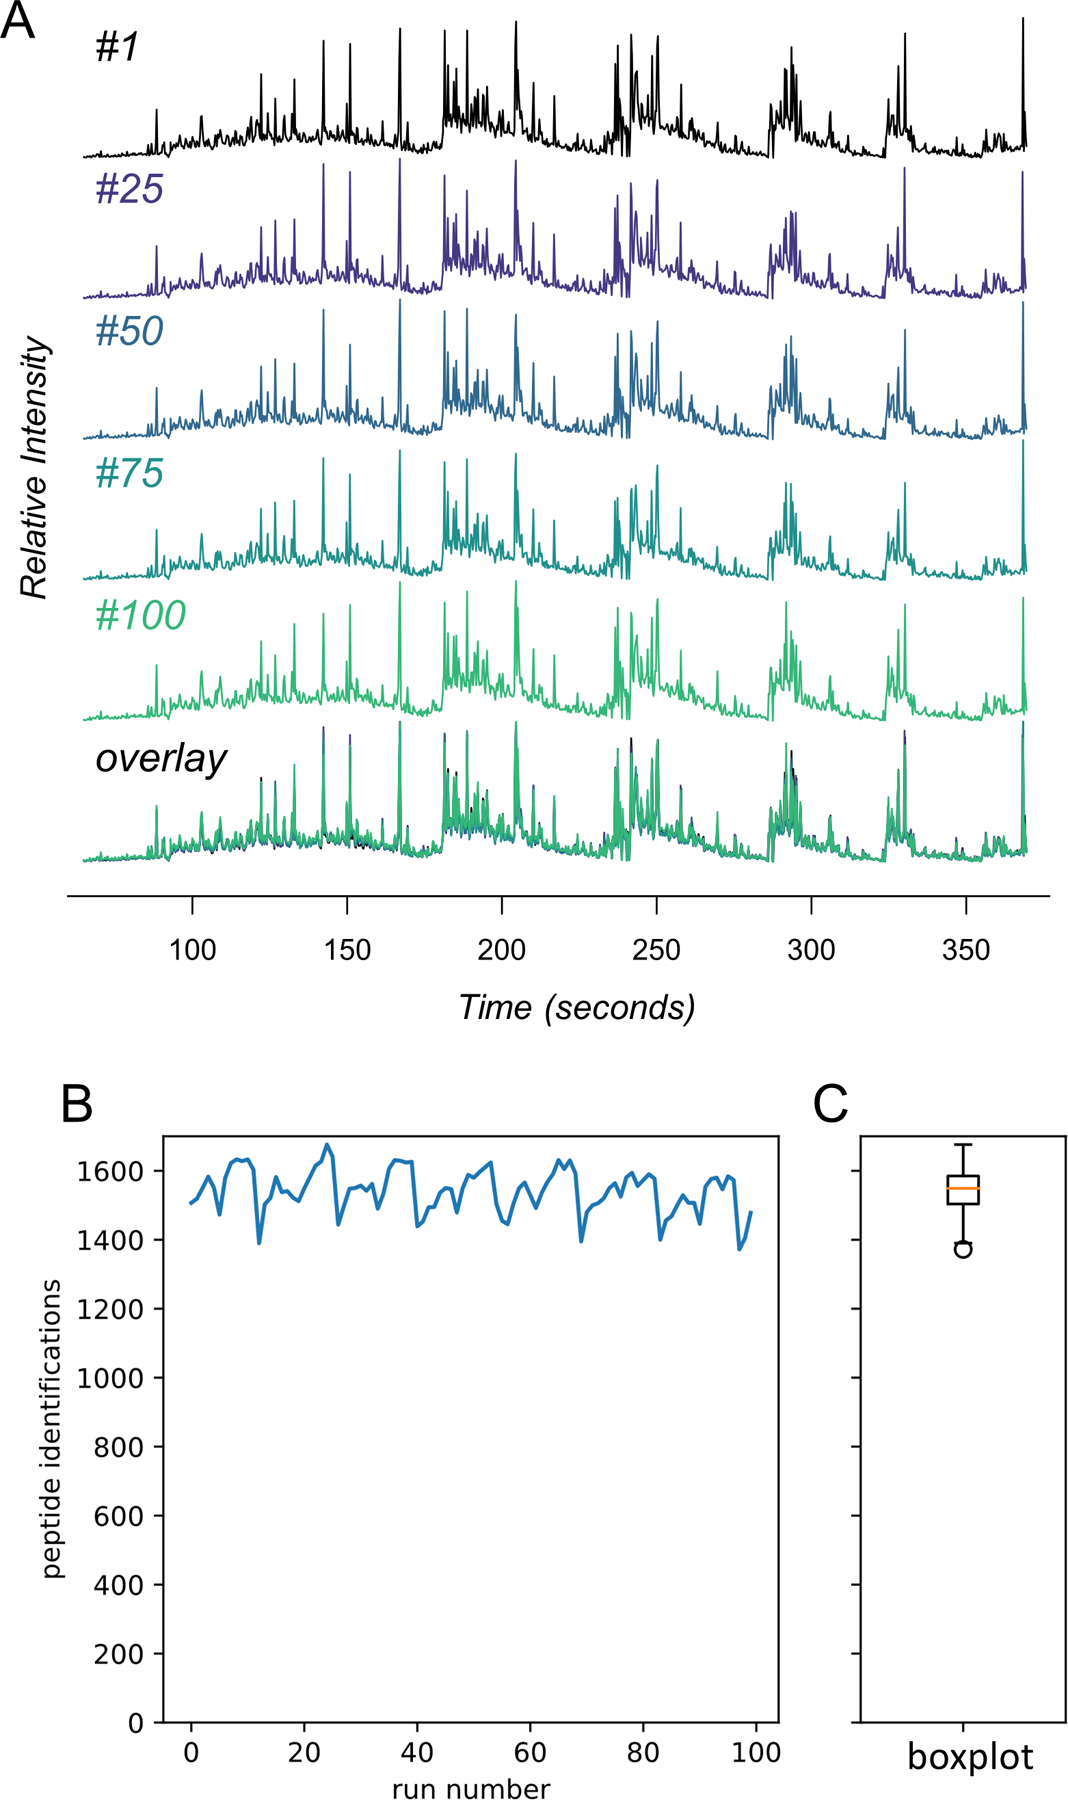
Tryptic peptides from the MCF7 proteome (1 mg/mL) were analyzed 100 times with a shortened version of the parameter scouting method (Extended Data Fig 3). (A) TIC traces of the infusion data from injection #1, #25, #50, #75, #100, and those five overlaid. (B) The number of peptide identifications from MSPLIT-DIA per analysis (FDR<0.01) and (C) the distribution of peptide identifications summarized as a boxplot. The boxplot shows the median (percentile 50%) with an orange line, and the box represents the inner quartile range (IQR) Q1 and Q3 (percentiles 25 and 75). Whiskers show Q1 – 1.5*IQR and Q3 + 1.5*IQR.