Figure 5.

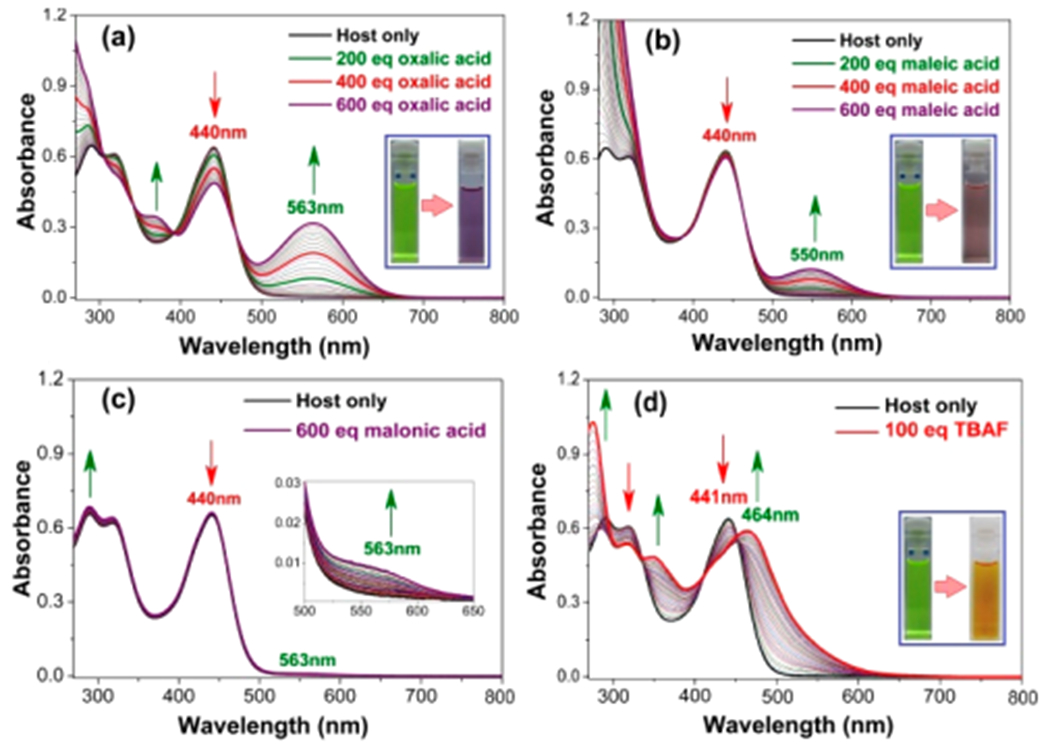
(a–d) Representative UV–vis spectroscopic titrations showing the changes in the spectral features observed when receptor 7•7 is titrated with increasing quantities of (up to 600 equiv) oxalic acid, maleic acid, malonic acid, and TBAF (100 equiv), respectively. All experiments were carried out with [7•7] = 1.00 × 10⁻⁵ M in anhydrous THF at 298 K. Insets: Photographs under ambient light of the initial host solution and the corresponding solutions obtained after the addition of the indicated titrants.
