Figure 4.

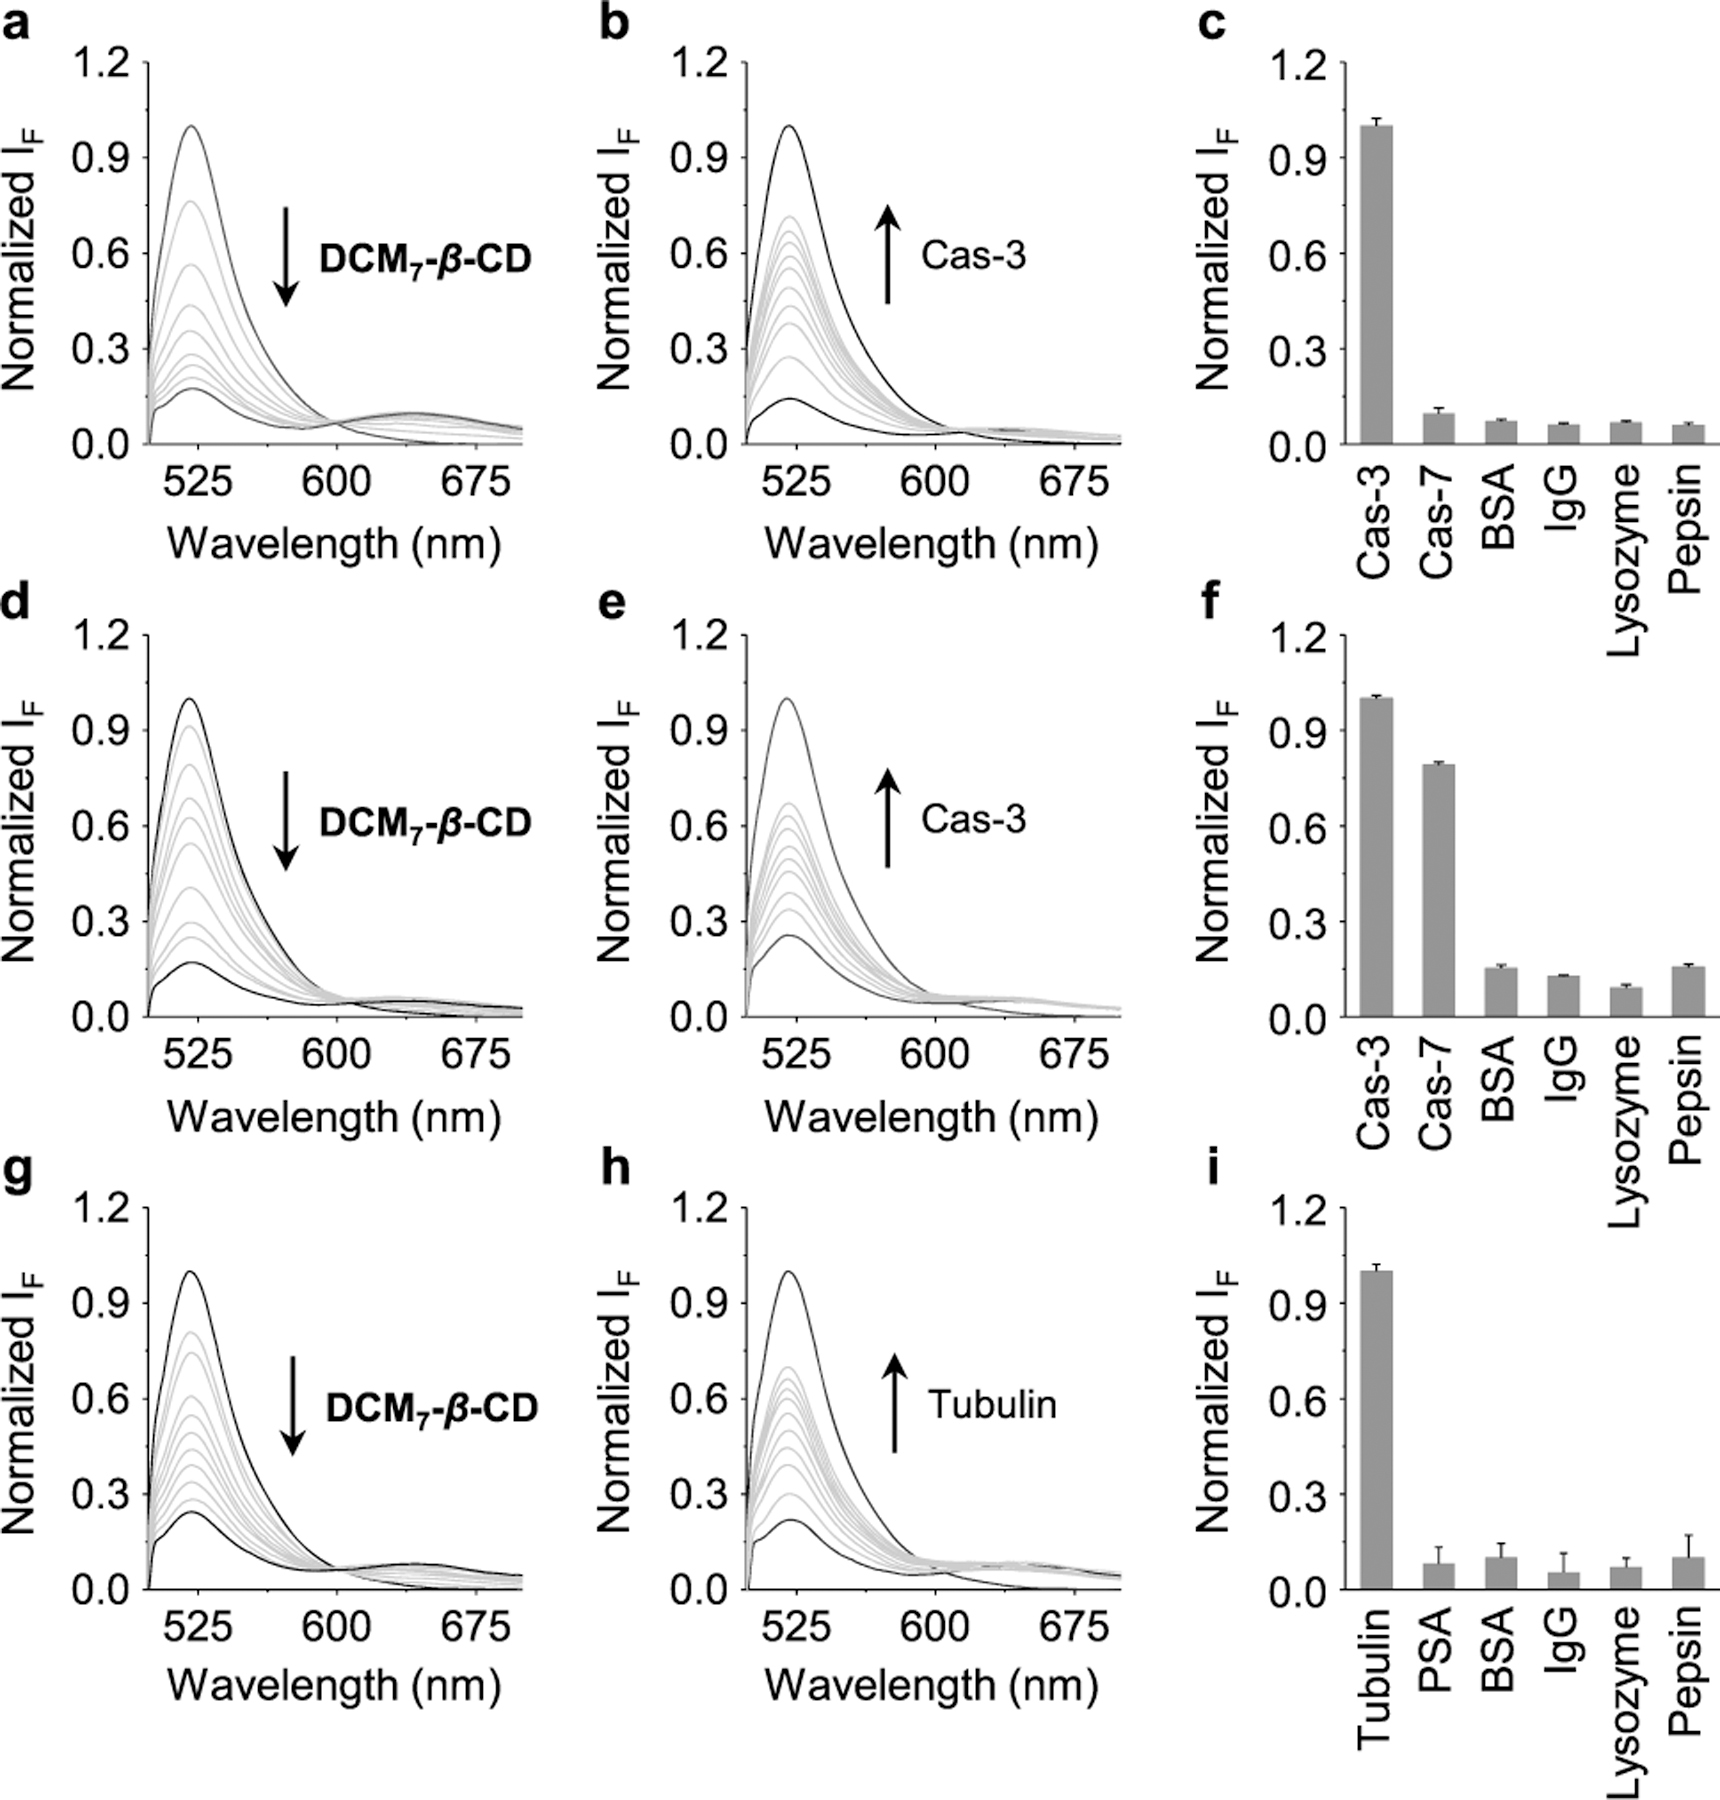
(a) Fluorescence spectra of P1 (0.17 μM) recorded in the presence of increasing concentrations DCM7-β-CD (0–7.3 μM). (b) Fluorescence spectra of Spd-1 (P1/DCM7-β-CD = 0.17 μM/7.3 μM) recorded in the presence of increasing caspase-3, (Cas-3; 0–46 nM). (c) Normalized fluorescence intensity of Spd-1 (P1/DCM7-β-CD = 0.167 μM/7.3 μM) recorded in the presence of Cas-3 (46 nM) or other proteins (46 nM) (Cas-7 = caspase-7; BSA= bovine serum albumin; IgG = immunoglobulin G). (d) Fluorescence spectra of P2 (0.25 μM) recorded in the presence of increasing DCM7-β-CD (0–6 μM). (e) Fluorescence spectra of Spd-2 (P2/DCM7-β-CD = 0.25 μM/6 μM) recorded in the presence of increasing Cas-3 (0–46 nM). (e) Fluorescence spectra of Spd-2 (P2/DCM7-β-CD = 0.25 μM/6 μM) recorded in the presence of increasing Cas-3 (0–46 nM). (f) Normalized fluorescence intensity of Spd-2 (P2/DCM7-β-CD = 0.25 μM/6 μM) recorded in the presence of Cas-3 (46 nM) and other proteins (46 nM). (g) Fluorescence spectra of P3 (0.25 μM) recorded in the presence of increasing DCM7-β-CD (0–5 μM). (h) Fluorescence spectra of Spd-3 (P3/DCM7-β-CD = 0.25 μM/5 μM) recorded in the presence of increasing tubulin (0–36 nM). (i) Normalized fluorescence spectra of Spd-3 (P3/DCM7-β-CD, 0.25 μM/5 μM) recorded in the presence of tubulin (36 nM) and other proteins (36 nM) (PSA = Pisum sativum agglutinin). All fluorescence measurements were carried out in phosphate buffered saline solution (0.1 M, pH 7.4) with an excitation wavelength of 470 nm.
