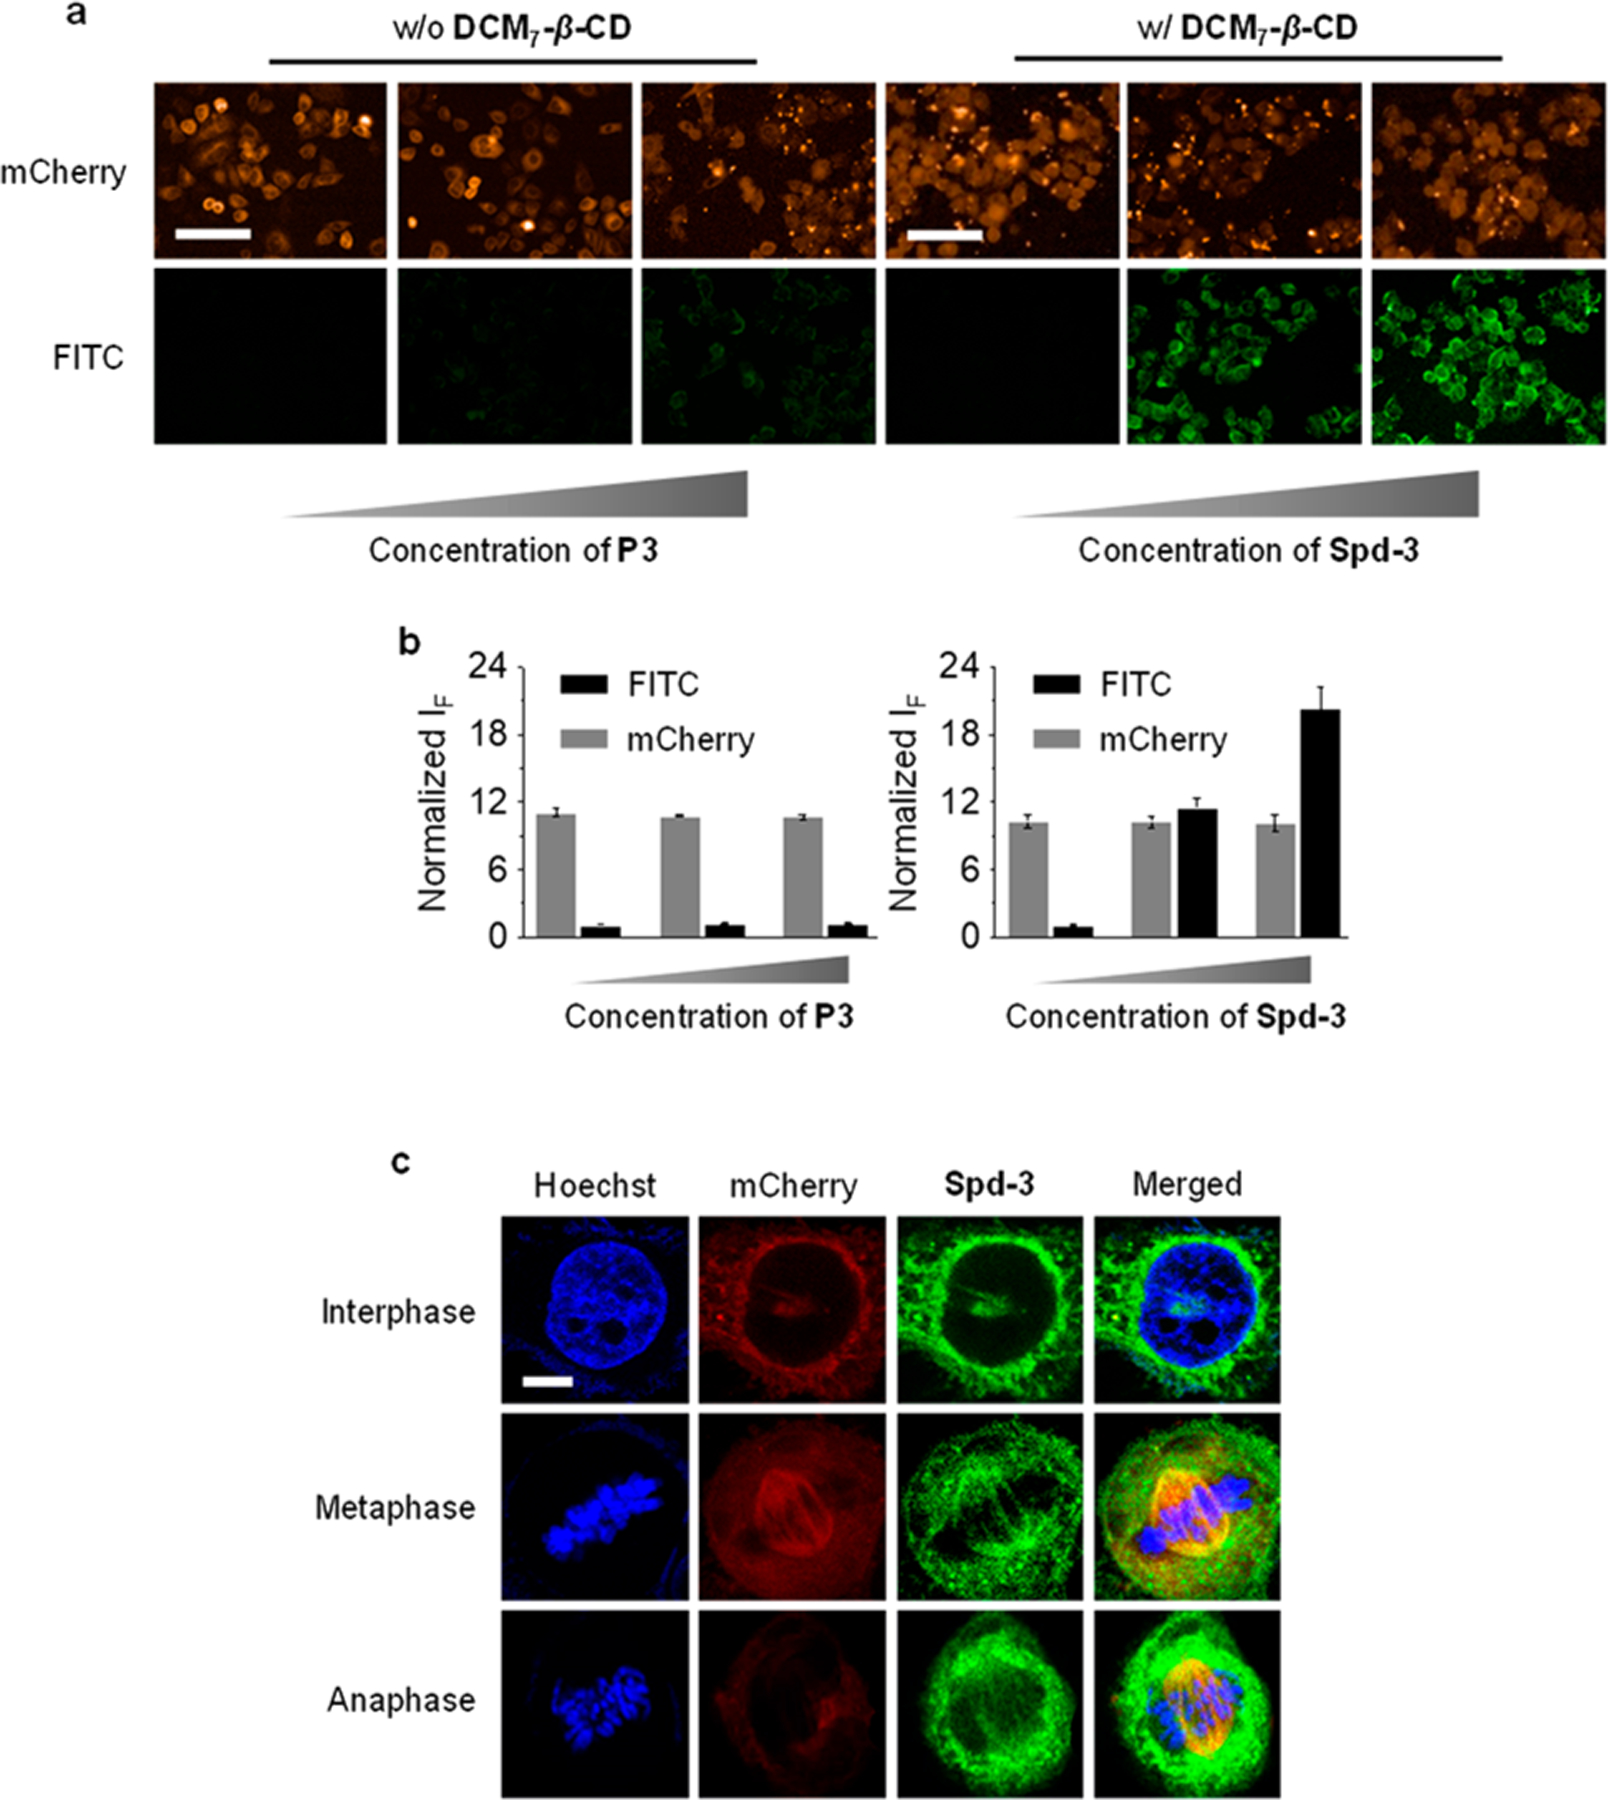
Figure 6.

Dose-dependent fluorescence imaging (a) and quantification (b) of HeLa cells treated with P3 (0.25, 0.5, and 1 μM) or Spd-3 (P3/DCM7-β-CD = 0.25/4 μM, 0.5/5 μM, 1/8 μM). HeLa cells using stably expressed mCherry-α-tubulin for cell mitosis imaging. Excitation and emission channels for FITC are 460–490 and 500–550 nm, respectively. Excitation and emission channels for mCherry are 560–580 and 580–650 nm, respectively. Cell nuclei were stained by Hoechst (excitation and emission channels are 360–400 and 410–480 nm, respectively). (c) Imaging of mitosis of HeLa cells by confocal microscopy. Excitation channels for DNA (stained by Hoechst), FITC, and mCherry are 405, 488, and 552 nm, respectively. Emission channels for DNA, FITC, and mCherry are 430–480, 490–540, and 570–640 nm, respectively. Scale bar = 100 μm (applicable to all images in Figure 6a); scale bar = 20 μm (applicable to all images in Figure 6e).
