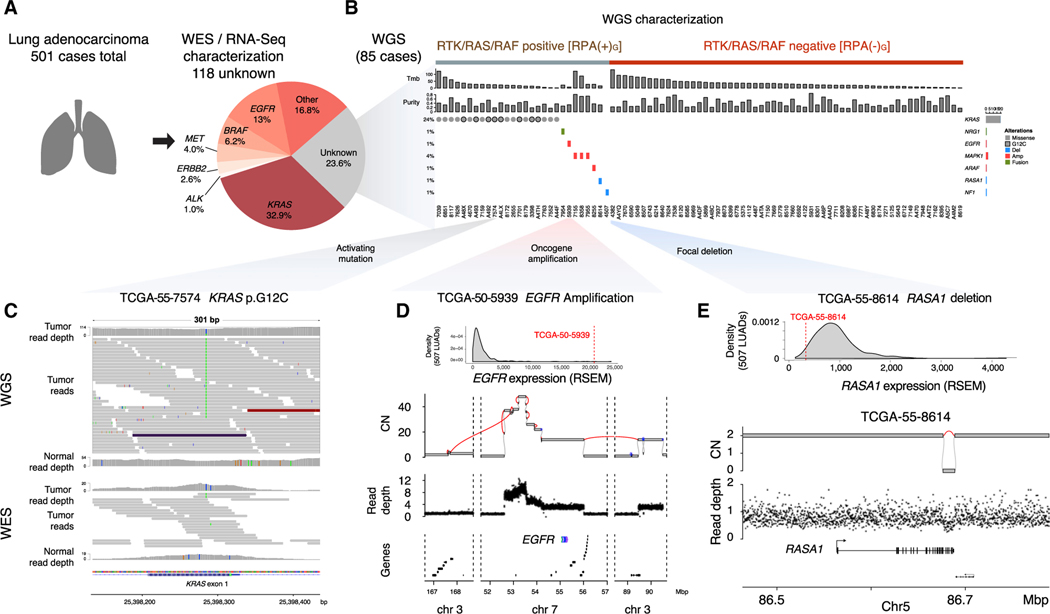
Figure 1. Identification of RPA(–) LUADs.
(A) Identification of 118 RPA(–)E LUAD cases from the 501 TCGA LUAD cohort, defined by WES or RNA-seq analysis. Eighty-five of the 118 samples were sent for WGS. The RTK/RAS/RAF pathway alterations used to define the RPA(+) or RPA(–) cases are listed in Table S1.
(B) WGS uncovered genomic alterations in the RTK/RAS/RAF pathway in 28/85 samples; 57/85 samples remain as RPA(–) after WGS analysis.
(C) Visualization of sequencing reads covering a KRAS p.G12C mutation in WGS (upper panel) and WES (lower panel) for sample (TCGA-55–7574). Both read depth and the number of reads supporting the mutation are higher in WGS than in WES.
(D) An example of EGFR amplification coupled with EGFR overexpression in TCGA-50–5939. In the second panel, purity-adjusted copy number and SV junctions (red lines) support a BFBC event underlying the amplification. Lower panels indicate WGS read depth and gene location in the region. CN, copy number.
(E) Example of a RASA1 simple deletion spanning from exon 21 to the end of the gene (12 kbp) coupled with RASA1 loss of expression in TCGA-55–8614.
See also Figure S1.

