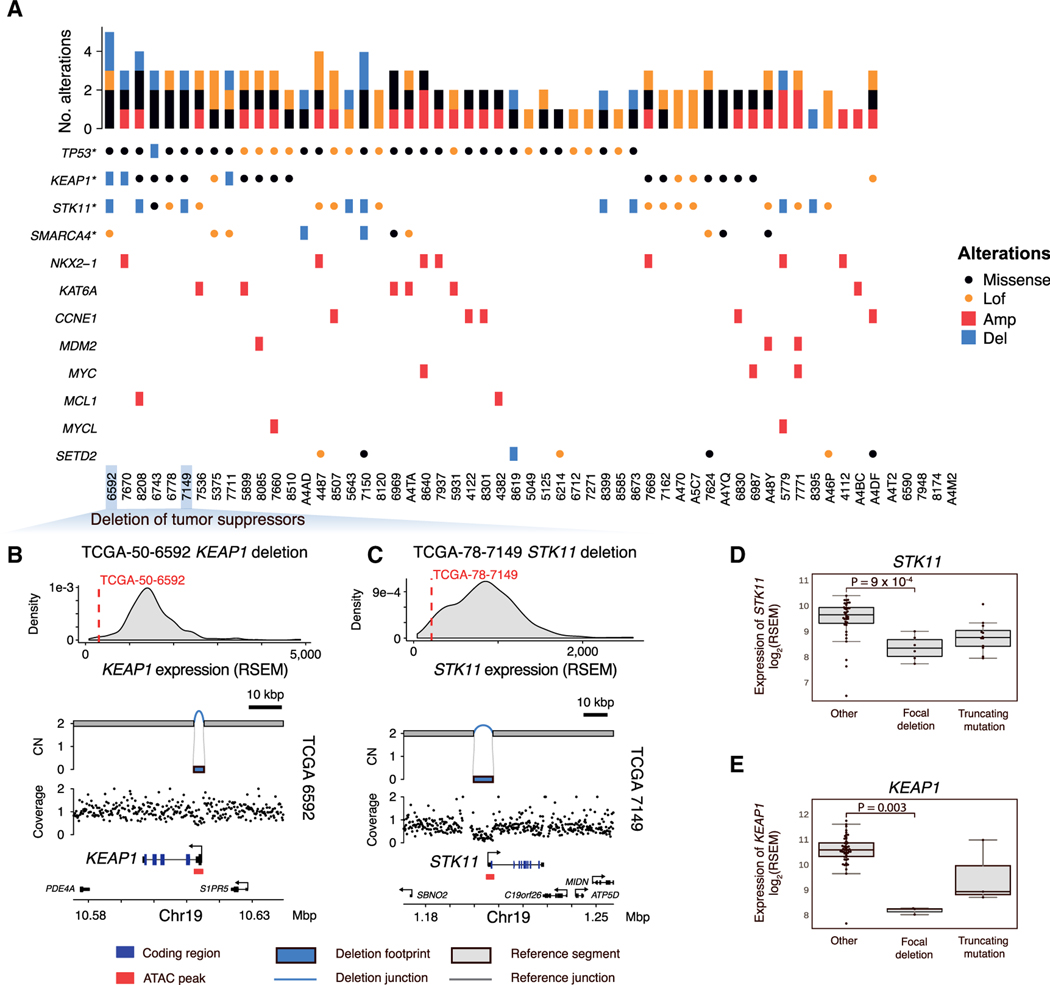
Figure 2. Recurrent coding alterations in RPA(–)G LUADs.
(A) Overview of genomic alterations in 57 RPA(–)G LUADs. Genes significantly mutated (*) or significantly amplified/deleted in the RPA(–)G samples are listed.
(B and C) Example of KEAP1 (3 kbp length) (B) and (C) STK11 (8 kbp length) simple, homozygous deletion (CN = 0), resulting in loss of expression. The distribution of the KEAP1 or STK11 expression is plotted based on the full TCGA LUAD cohort.
(D) Expression comparison of samples with loss-of-function alterations in STK11 and (E) KEAP1 to other RPA(–)G LUAD samples. p values are calculated from Mann-Whitney U tests. Boxplots show median, interquartile range, and 1.5 times the interquartile range.
See also Figure S1.

