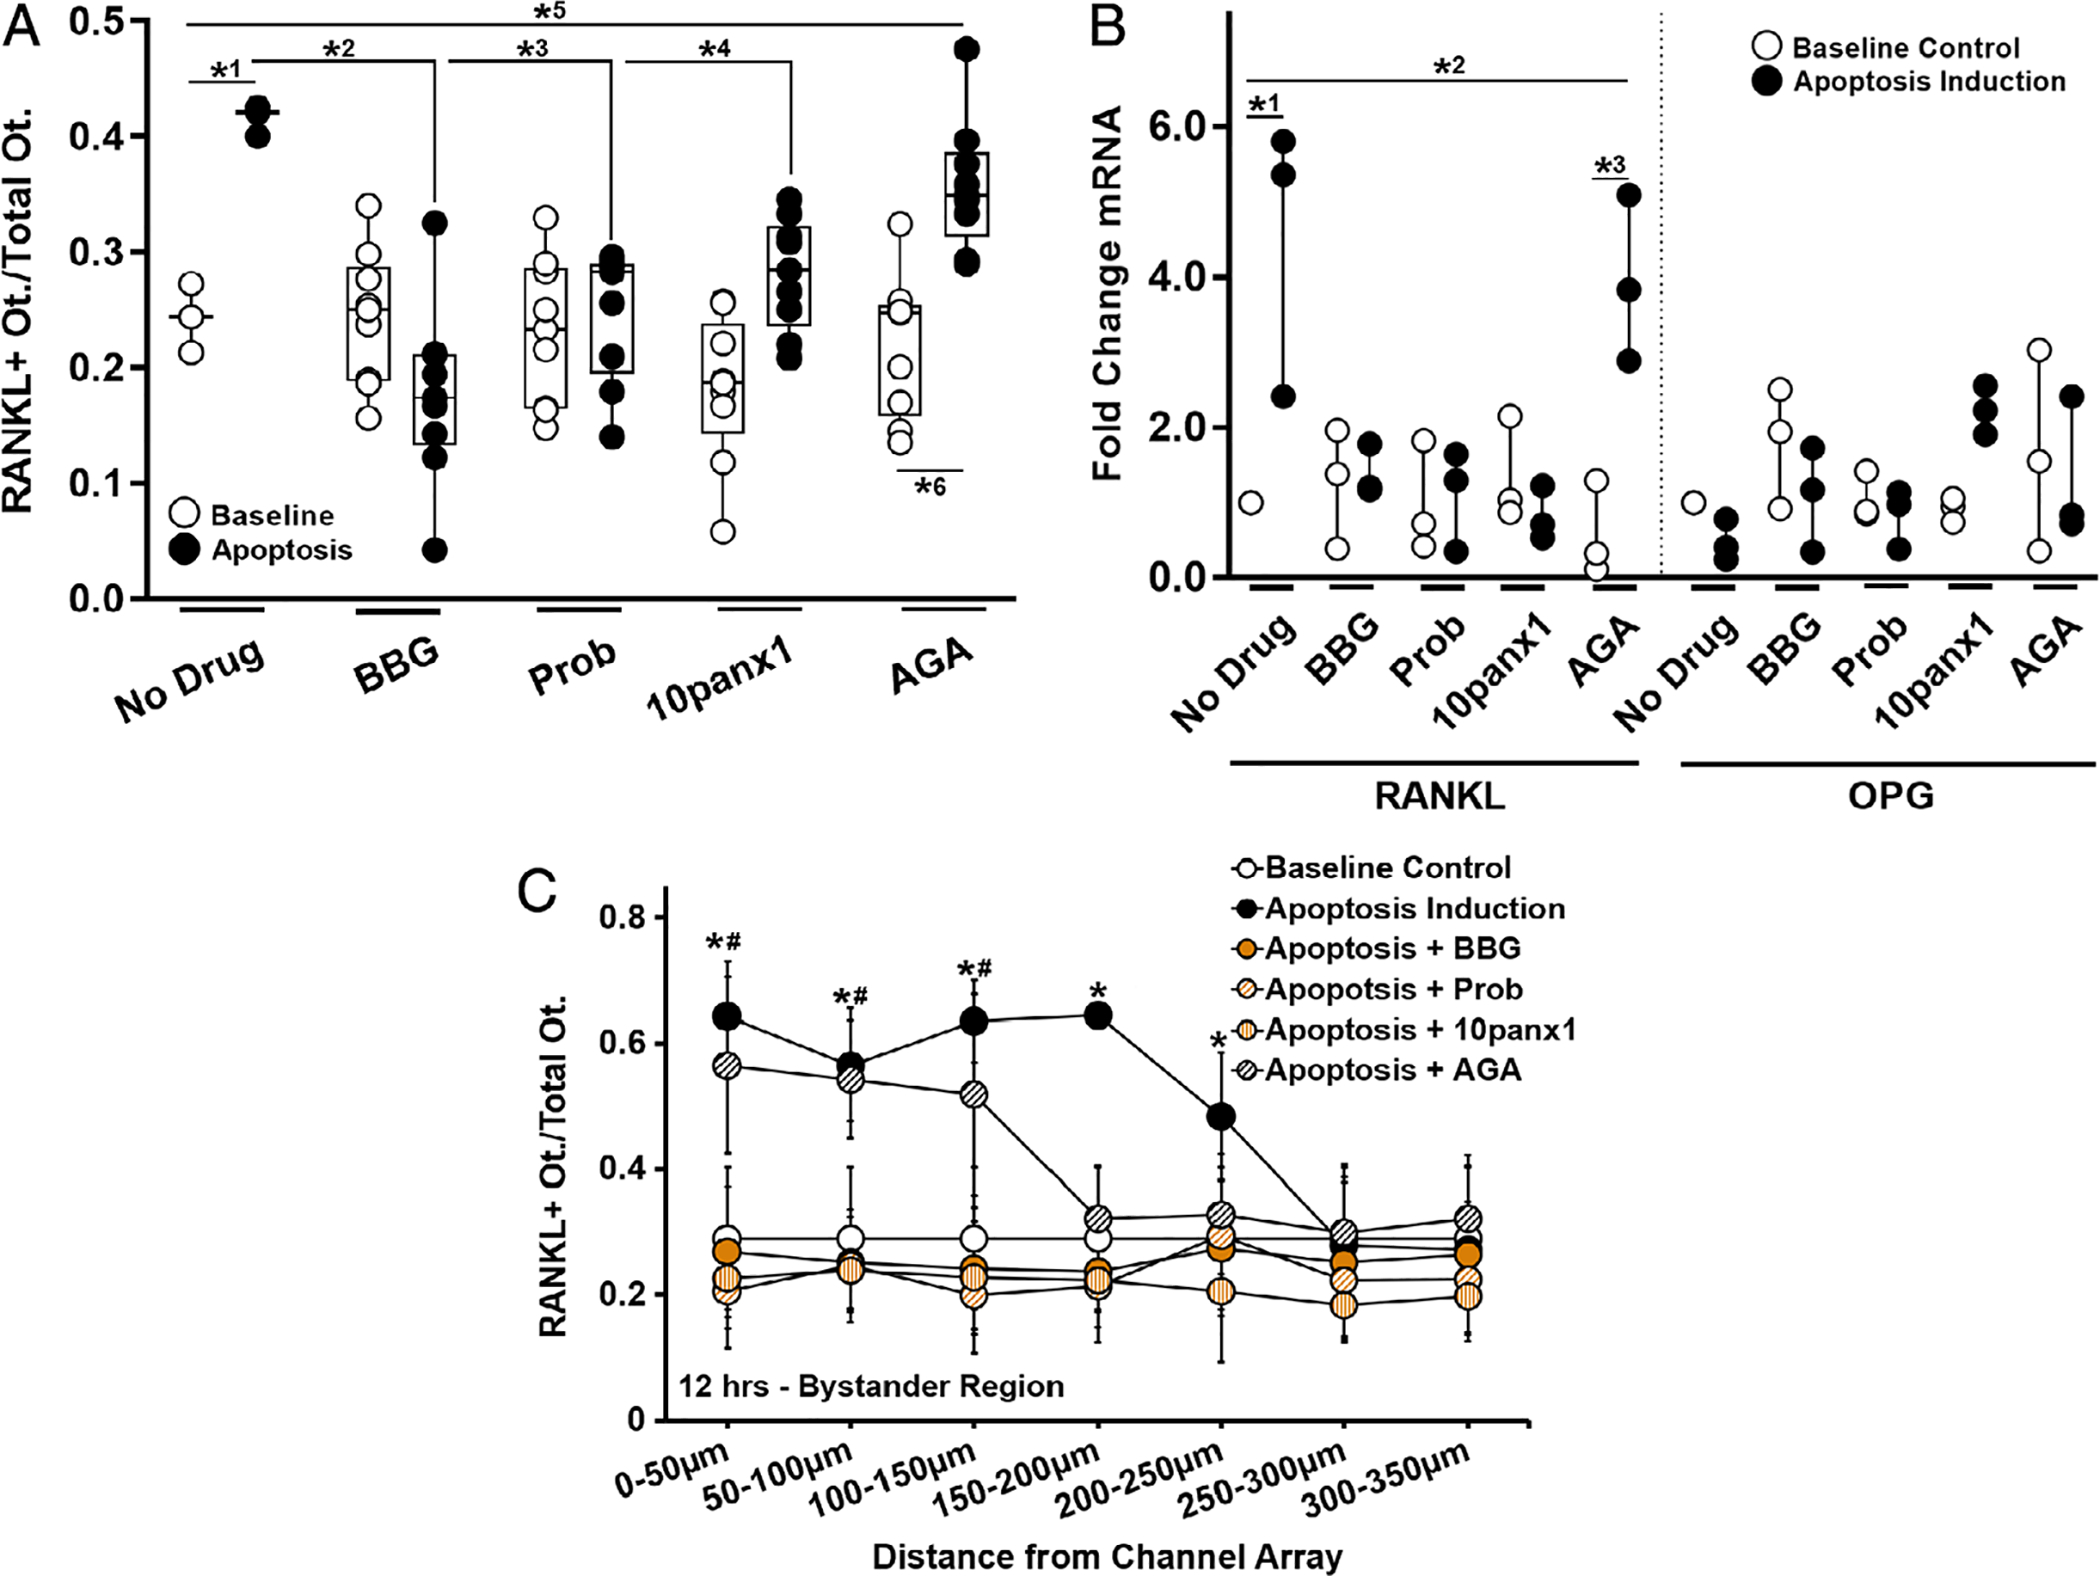
Fig. 5.

Effect of Panx1, P2X7, and Cx43 inhibition on bystander osteocyte RANKL expression. (A) Increased numbers of RANKL-expressing bystander osteocytes after apoptosis was induced in the neighboring chamber (*1p = .024) was prevented by inhibition of P2X7 by BBG (10μM) (*2p = .0001) or by blocking Panx1 using probenecid (Prob, 500μM) (*3p = .003) or biomimetic peptide 10panx1 (100μM) (*4p = .038). Blocking Cx43 (AGA, 30μM) did not prevent the increase in RANKL-expressing osteocytes in the bystander compartment (*5p = .008 versus baseline control and *6p < .001 versus AGA treated non-apoptotic control), n = 3 devices for controls and n = 9 devices for treatment groups. (B) The effects of channel inhibitors on RANKL and OPG mRNA expression in bystander osteocytes with and without apoptosis induction of apoptosis in the neighboring chamber. Increased in RANKL gene expression was blocked by BBG, Prob, and 10panx1 (all p = .999 versus baseline, but not by blocking Cx43 with AGA; *2p = .011 versus baseline control and *3p = .004 versus non-apoptotic AGA-treated group), n = 3 samples (three devices per sample), tested in triplicate. (C) The effects of channel inhibitors on the distribution of RANKL-expressing osteocytes as a function of the distance from the nanochannel array/apoptotic signal source. Note that whereas probenecid, 10panx1, and BBG prevented RANKL upregulation in all regions, blocking Cx43 (AGA) altered the extent of the spread from the nanochannel array/apoptotic signal source (n = 9 devices), and this effect was significant up to 150 to 200 μm away from the nanochannel array/apoptotic signal source. All other treatments did not differ from baseline control or among themselves. Apoptosis induction-no drug control versus baseline control (*p = .004 at 0 to 50 μm, p = .01 at 50 to 100 μm, p < .001 at 100 to 150 μm, p < .0001 at 150 to 200 μm, and p = .041 at 200 to 250 μm). Apoptosis induction–AGA-treated versus baseline control (#p < .001 at 0 to 50 μm, p < .0001 at 50 to 100 μm, and p = .002 at 100 to 150 μm). Data are shown as mean ± SD.
