. 2020 Aug 13;1(4):273–280. doi: 10.1039/d0cb00075b

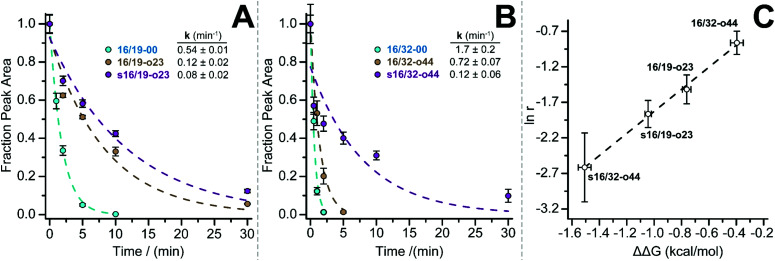
Fig. 2. Proteolysis of (A) 16/19-00 (blue circles), 16/19-o23 (brown circles), and s16/19-o23 (magenta circles) and of (B) 16/32-00 (blue circles), 16/32-o44 (brown circles), and s16/32-o44 by proteinase K (17 μg mL−1) at 50 μM protein concentration in 20 mM sodium phosphate buffer (pH 7) as monitored by HPLC. Data points represent the average of three replicate experiments. Solid lines represent fits of the data to a mono-exponential decay function, which was used to determine apparent proteolysis rate constants. (C) Plot of the impact of PEGylation or PEG stapling on proteolytic resistance (as assessed by the natural logarithm of r, the ratio of apparent proteolysis rate constant for PEGylated or PEG-stapled WW variants relative to their non-stapled non-PEGylated counterparts) vs. the impact of PEGylation or PEG stapling on WW conformational stability (ΔΔG). Dotted line represents fit of the ln r vs. ΔΔG data to a linear equation. Slope = 1.55 ± 0.07; intercept = −0.28 ± 0.07; R2 = 0.996.

Fig. 2