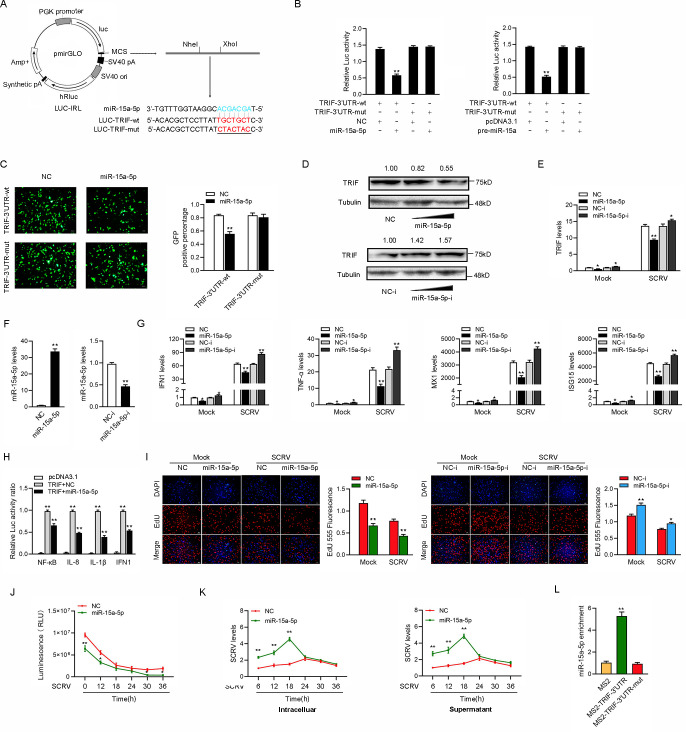
Fig 6. miR-15a-5p inhibits antiviral responses by targeting TRIF.
(A) Schematic illustration of TRIF-wt and TRIF-mut luciferase reporter vectors. (B) The relative luciferase activities were detected in EPC cells after cotransfection with TRIF-wt or TRIF-mut and mimics, pre-miR-15a plasmid, or NC. (C) miR-15a-5p downregulated GFP expression. EPC cells were cotransfected with TRIF-3’UTR-wt or TRIF-3’UTR-mut and mimics or NC. The fluorescence intensity and the GFP expression were evaluated by enzyme-labeled instrument. (D and E) Relative protein and mRNA levels of TRIF were evaluated by western blot (D) and qRT-PCR (E) in MIC cells after cotransfected with the miR-15a-5p mimics or inhibitors. (F) The miR-15a-5p expression levels were detected in MIC cells after cotransfection with NC or mimics (left panel) and NC-i or inhibitors (right panel). (G) qRT-PCR assays were performed to determine the expression levels of IFN1, TNF-α, MX1, and ISG15 in cells after cotransfected with NC or mimics and cells after cotransfected with NC-i or inhibitors. (H) The relative luciferase activities were detected in MIC cells after cotransfection with TRIF expression plasmid, phRL-TK Renilla luciferase plasmid, luciferase reporter genes, NC, or mimics. (I and J) Cell proliferation was assessed by EdU assays in MIC cells after cotransfected with NC or mimics (I) and cells after cotransfected with NC-i or inhibitors (J). (K) Effect of miR-15a-5p on cell viability after SCRV infection. MIC cells were transfected with si-Ctrl, si-circ, vector or oe-circ for 24 h, then treated with SCRV for different times. Cell viability assay were measured. (M) miR-15a-5p promote SCRV replication. MIC cells were transfected with si-Ctrl or si-circ and vector or oe-circ plasmid for 24 h, respectively, then infected with SCRV at different times. The qPCR analysis was conducted for intracellular and supernatant SCRV RNA expression. (L) The MS2-RIP assay was executed in MIC cells after transfection with pcDNA3.1-MS2, pcDNA3.1-MS2-TRIF-3’UTR, pcDNA3.1-MS2-TRIF-3’UTR-mut, followed by qPCR to detect the enrichment of miR-15a-5p. Scale bar, 20 μm. All data represented the mean ± SD from three independent triplicated experiments. *, p < 0.05; **, p < 0.01.

