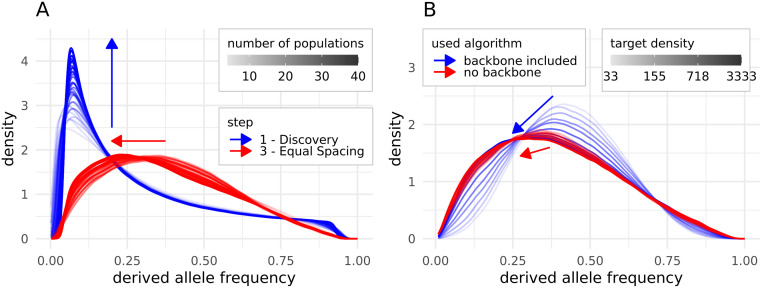
Fig 4. Impact of a varying number of discovery populations (A) or target density (B) on the derived allele frequency spectrum.
For A, blue indicates the spectra after the discovery step and red after the equal spacing step. For B, only the equal spacing step is shown and blue indicates that the algorithm including the initial backbone, while red shows the results without the backbone included in the algorithm. Different numbers of populations in the discovery set (4 to 40) or the increase in the target density are indicated by an intensifying color gradient and only one representative and randomly picked run per population number/ target density is shown. As the differences in the color gradients are hard to distinguish, arrows in the respective color are indicating the shift of the spectra with increasing numbers of discovery populations.

