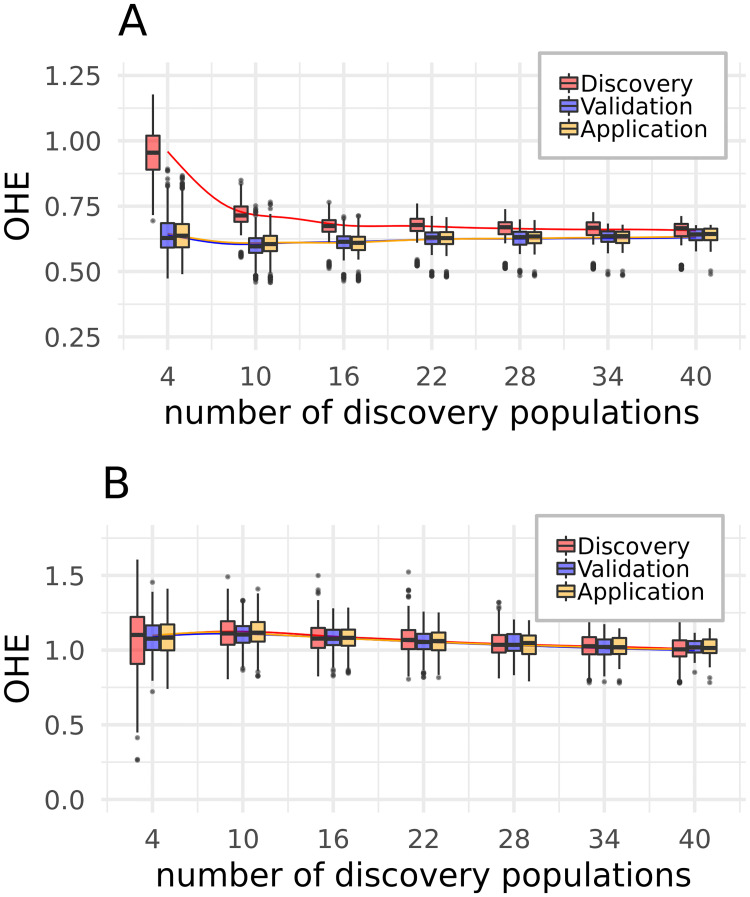
Fig 6. Relation of the OHE as a function of the number of discovery populations.
A—discovery, B—equal spacing. While the number of discovery populations was varied from 4 to 40 by increments of one, the Boxplots are only shown for a subset of the number of discovery populations to avoid a crowded figure. The smoothing lines, which show the trend, are calculated from all observations. Plots for all five steps can be found in S9 Fig.

