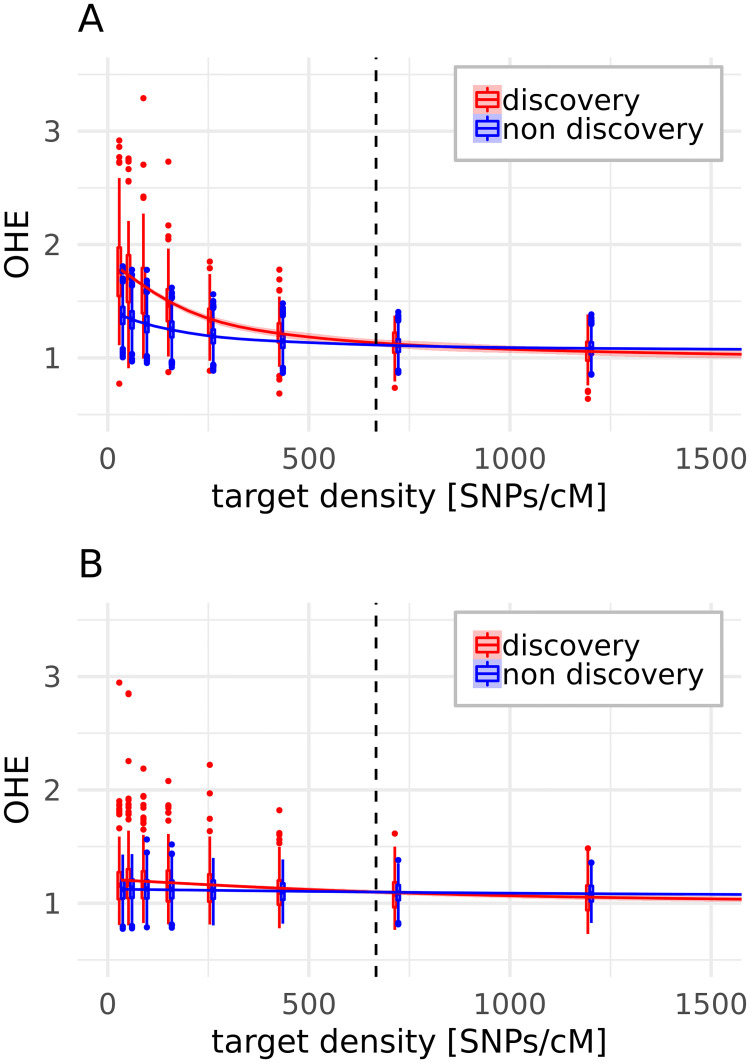
Fig 7. OHE after equal spacing (step 3) by target density in SNPs/cM and population group.
The smoothing lines show the trend and the dashed lines the target density of 667 SNPs/cM, used for the remodeling according to the original array [21]. The algorithm was run including the initial backbone SNPs (A) or not including them (B). Gallus varius is not included, as it is constantly underestimated.

