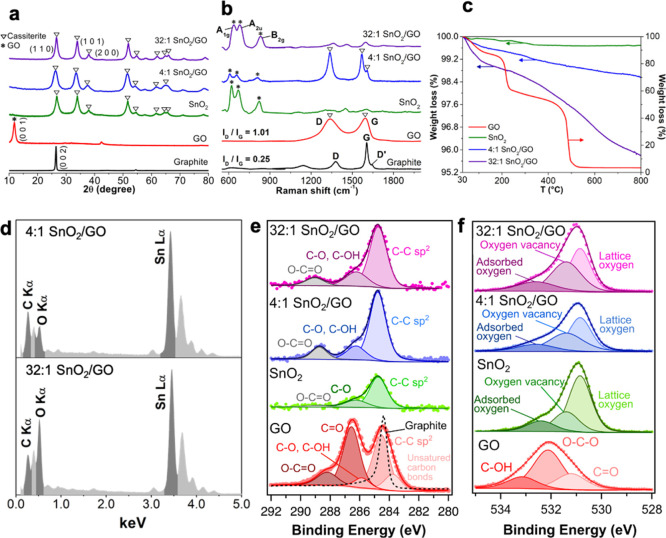
Figure 1.
(a) XRD patterns of graphite, GO, pure SnO2, and hybrid SnO2–GO samples. (b) Raman spectra of all the investigated samples. (c) TGA spectra of GO, pure, and hybrid nanopowders. (d) EDX spectra of 4:1 SnO2–GO and 32:1 SnO2–GO. XP spectra of (e) C 1s and (f) O 1s regions of graphite, GO, 4:1, and 32:1 SnO2–GO.

