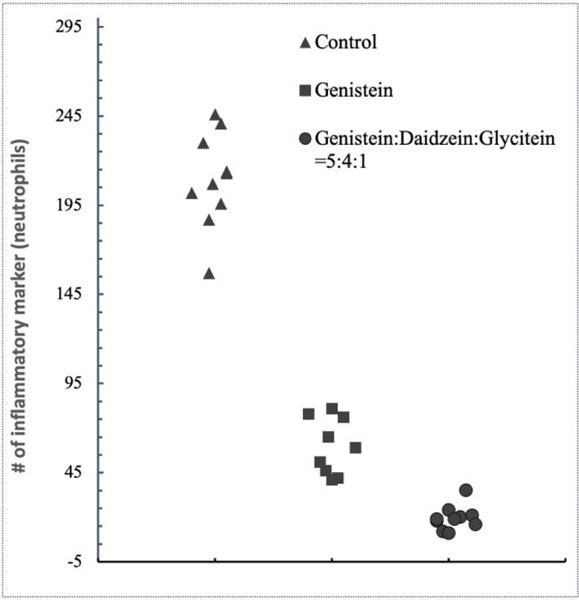
Fig. 11.
Scatter plot obtained by imagePro software demonstrating the relative number of neutrophil cells for in vivo tissue sections from control, genistein and genistein:daidzein:glycitein=5:4:1 samples (n=10 slides). The imagePro software defined the difference as statistically significant (p<0.001).

