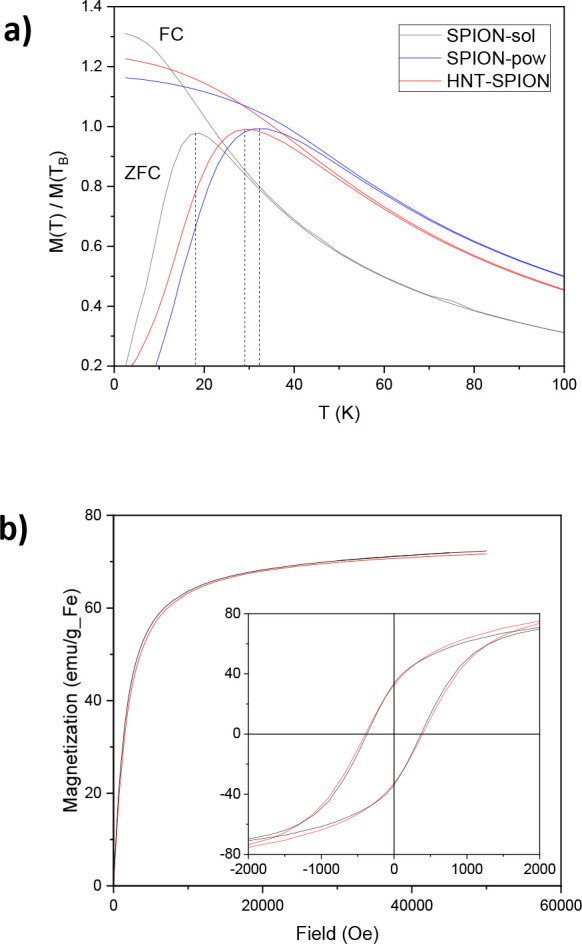
Figure 5.

(a) ZFC (lower curve) and FC (upper curve) magnetizations acquired with a 50 Oe field. The vertical dashed lines remark the position of the ZFC maxima corresponding to the blocking temperatures (TB). For a better presentation, each curve was normalized to the magnetization value at the corresponding TB. (b) Magnetization curves at high (300 K, main panel) and low (2.5 K, inset) temperature for SPION (black line) and SPION-in-HNT (red line).
