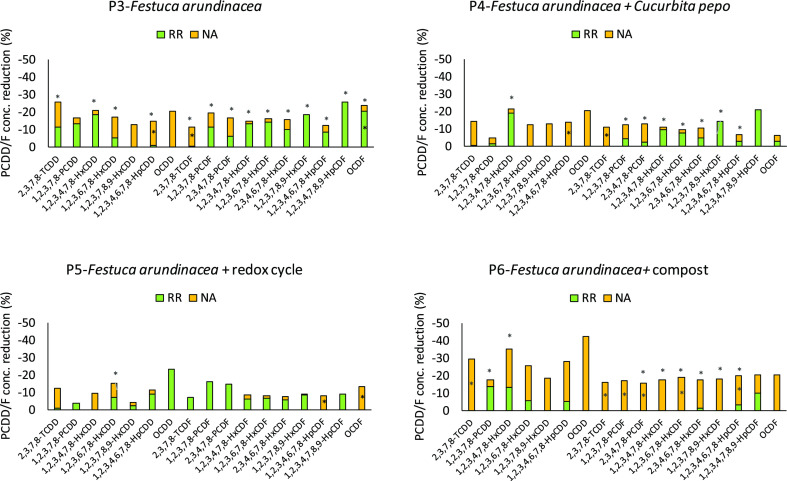
Figure 1.
Contribution of NA and RR to the overall PCDD/F concentration reduction at T4. Asterisks indicate statistically significant reduction for NA (when contained in the orange bar), for RR (when contained in the green bar), and overall (when the asterisk is above the bar). (For interpretation of the references to color in this figure legend, the reader is referred to the web version of this article).

