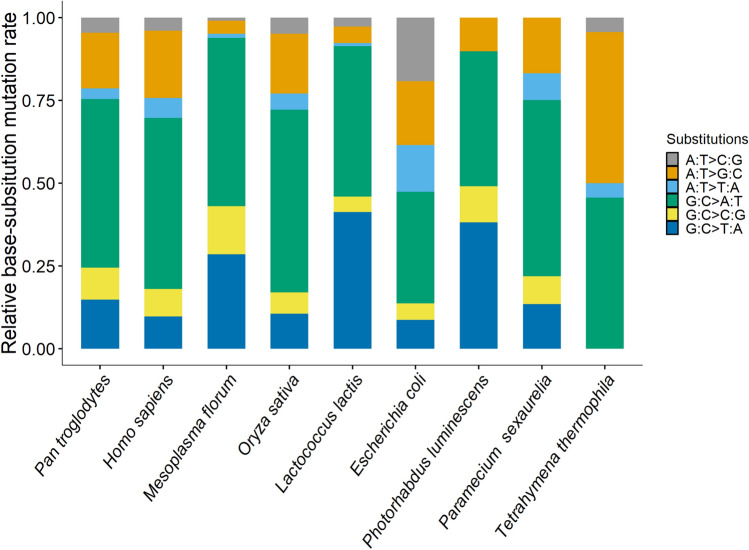
Fig. 1.
The relative base substitution mutation rates of different organisms, which cover almost the full range of mutation rates of repair-functional organisms (Long et al. 2016, 2018a; Lynch et al. 2016). From left to right, the mutation rates are ordered from high to low and belong to Pan troglodytes verus, Homo sapiens CEU, YRI, Iceland, Mesoplasma florum L1, Oryza sativa, Lactococcus lactis DSMZ20481, Escherichia coli K-12 MG1655, Photorhabdus luminescens ATCC29999, Paramecium sexaurelia and Tetrahymena thermophila, respectively

