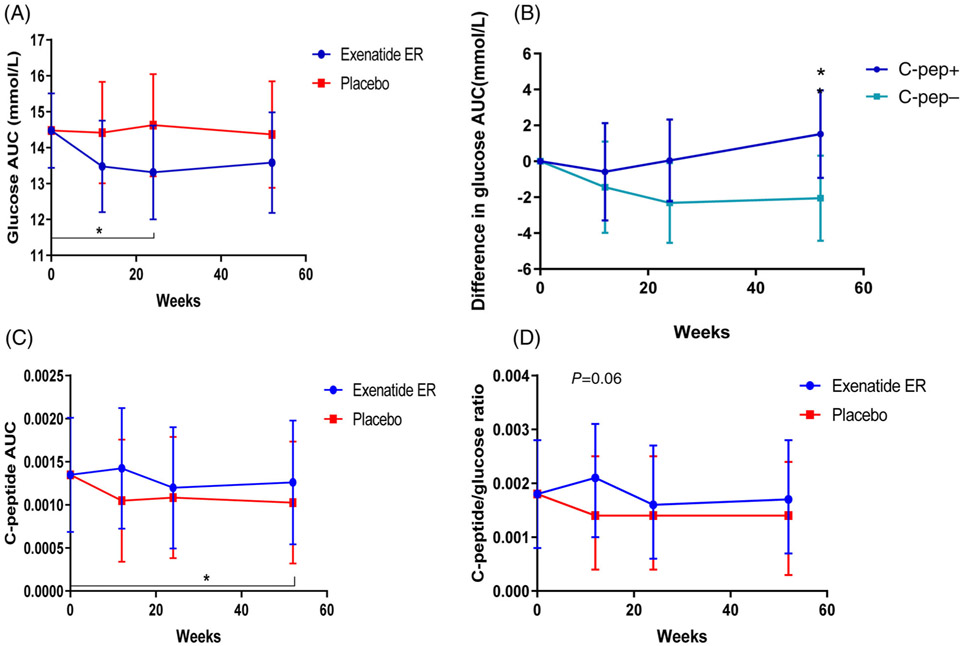
FIGURE 4.
Effects of exenatide extended release (ER) treatment on glucose and C-peptide responses. A, There was a significant reduction in the glucose area under the curve (AUC) at week 24 in the exenatide ER group compared to baseline (P = 0.04), but not compared to placebo (P = 0.1). B, There was a significant improvement, compared to baseline vs. placebo, in the group without detectable C-peptide at week 24 (P = 0.04). At 52 weeks there was a greater effect on the glucose AUC in the patients that did not have detectable C-peptide (C-pep−) compared to the patients that did (C-pep+; P = 0.04). C, C-peptide AUC (in pmol/mL/min) was compared between the exenatide ER- and placebo-treated patients by linear mixed model at each of the study time points in those with detectable C-peptide levels at baseline. Data are shown as ln(AUC/120 min + 1). There was a significant decline at 52 weeks, compared to the baseline, in patients treated with placebo for the first 24 weeks (P = 0.04). D, C-peptide:glucose ratio was compared in the two treatment arms for those with detectable C-peptide levels at baseline. There was a modest effect of exenatide ER on the C-peptide/glucose ratio at 12 weeks in comparison with placebo (P = 0.06). Units of nmol/L and mg/dl were used for calculation of the C-peptide/glucose ratio

