
Figure 2.
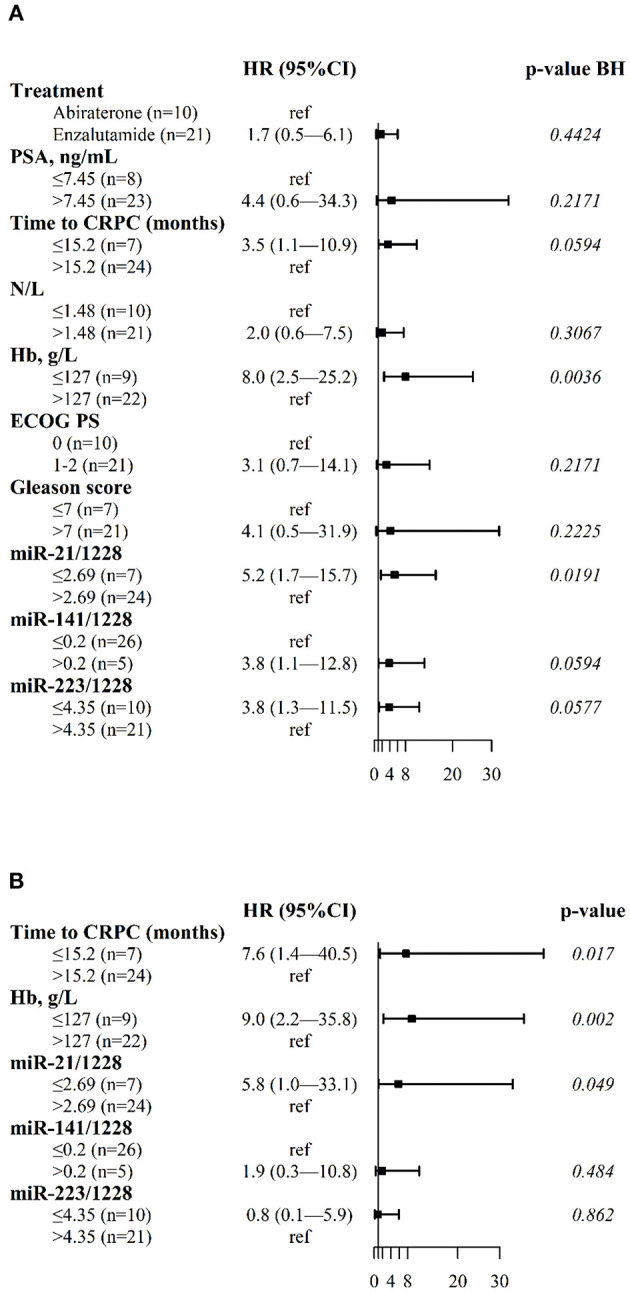
Forest plots of clinical variables and cfmiRNAs associated with OS. (A) Univariate Cox regression model (B) Multivariable Cox regression model. Indicated are the hazard ratios (HR) and 95% confidence intervals (CI) and corresponding p-values; p-value BH indicates the p-values determined using the Benjamini-Hochberg correction for multiple tests. Ref indicates the reference value for calculating the hazard ratio.