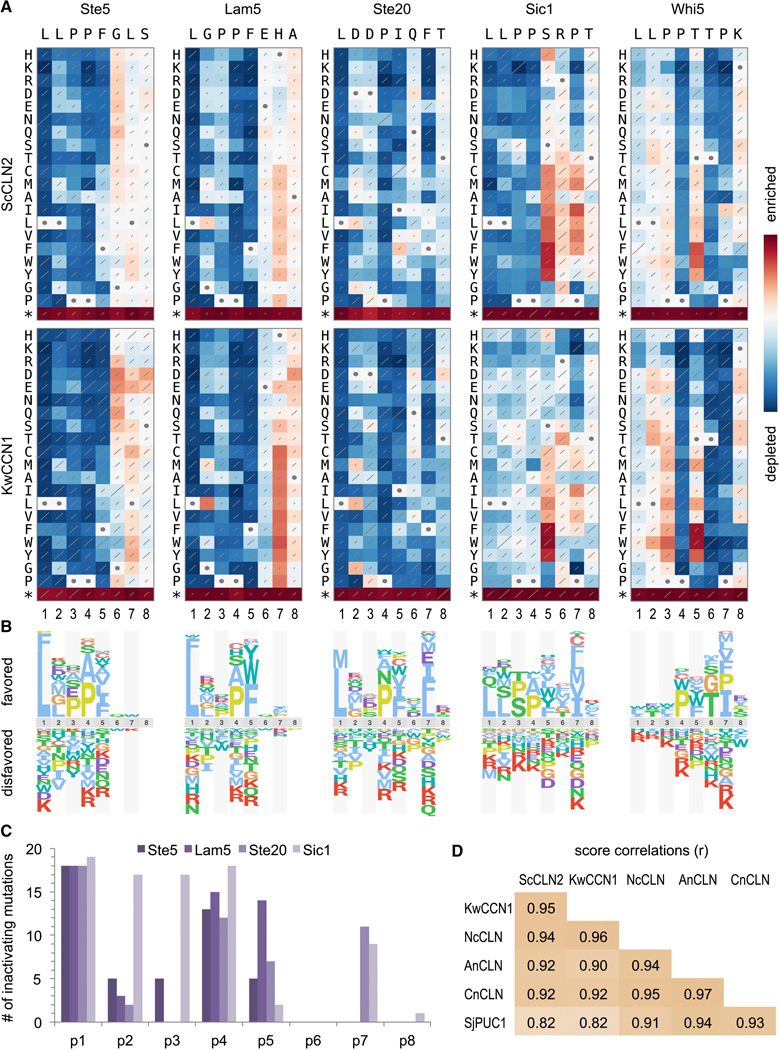
Figure 4. Comprehensive analysis of LP motif sequence preferences.
(A) Fitness effects of all single-residue substitutions in five motifs. Red and blue indicate better and worse performance, respectively, relative to the wild-type motif; each panel is scaled to its own maximum and minimum. Diagonal lines depict standard errors, scaled such that the highest value covers the entire diagonal. Circles denote wild-type residues. Data represent three independent experiments. See Figure S4 for analyses with four other cyclins.
(B) Sequence logos showing relative preferences of ScCLN2 along motifs in panel A.
(C) Number of inactivating mutations (defined as normalized scores within 15% of minimum; see Methods) at each position in 4 “typical” motifs (i.e., excluding Whi5). Also see Figure S5.
(D) Pearson correlation coefficients (r) for all pair-wise comparisons of cyclins, calculated from the raw fitness score matrices for all 5 motifs.

