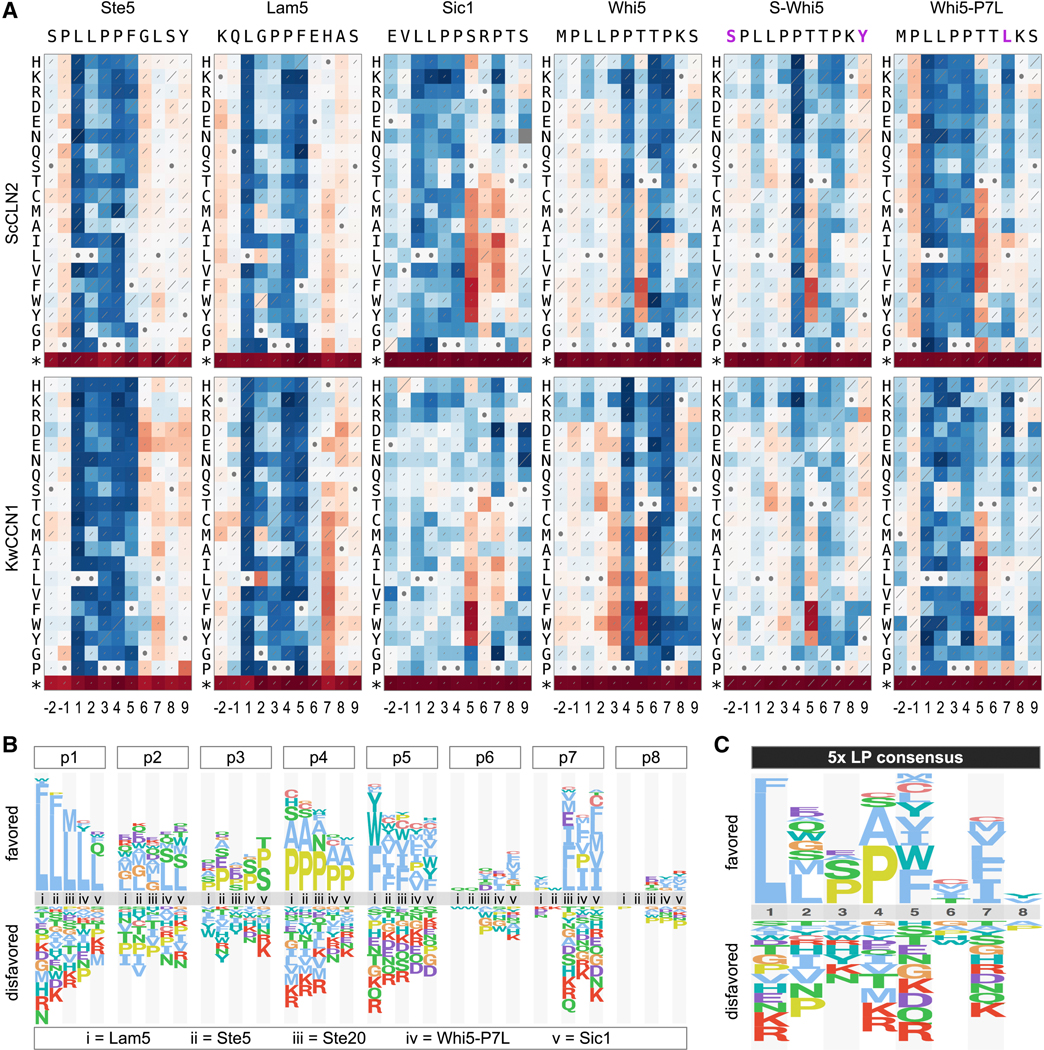
Figure 5. Analysis of atypical and consensus motif preferences.

(A) Heat maps (as in Figure 4A) from mutational scanning of 11-residue sequences for four wild-type motifs plus two variants of the Whi5 motif (S-Whi5 and Whi5-P7L; magenta letters indicate sequence changes). Data represent two independent experiments.
(B) Comparison of individual position preferences in five “typical” motifs.
(C) Sequence logo showing the consensus preferences of the motifs in panel B.
