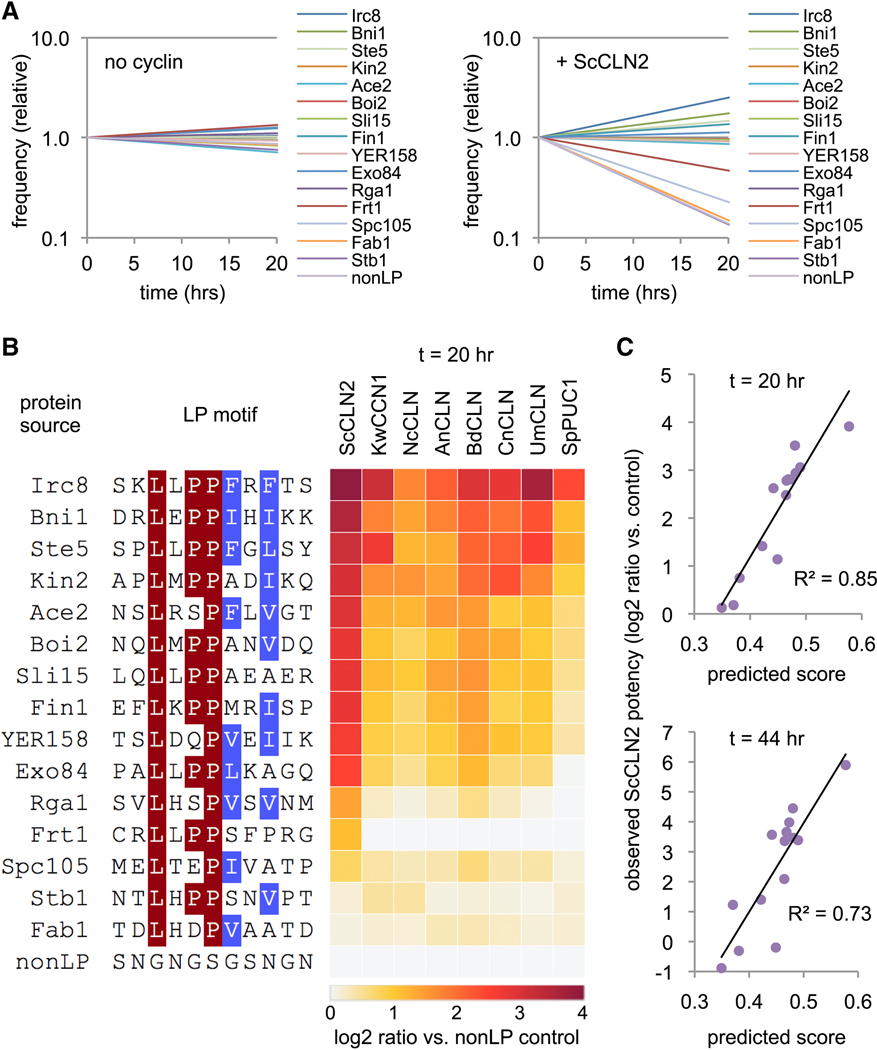
Figure 6. Observed and predicted potencies of new motifs.
(A) Frequency changes during competitive growth of 14 candidate LP motifs, plus Ste5 and nonLP controls, in cells with PGAL1-ScCLN2 or no cyclin. Plots show averages of two independent experiments.
(B) Panel A experiments were performed with eight PGAL1-cyclin strains. Heat map colors indicate the ratio (log2) of the change in frequency for each motif compared to the nonLP control (at 20 hr), normalized to the results in the no-cyclin strain; two independent experiments were averaged. Motif sequences are colored where >50% are identical (red) or similar (blue).
(C) Observed vs. predicted potency of new motifs (excluding Ste5 and nonLP controls). Observed potency is the log2 ratio value (as in panel B) for the ScCLN2 strain, at 20 or 44 hr. Predicted scores were derived from the preference score consensus PSSM (see Figures 5C and S6A) by calculating the sum of PSSM values for the residues at p1-p8 of each motif.
Also see Data S1.

