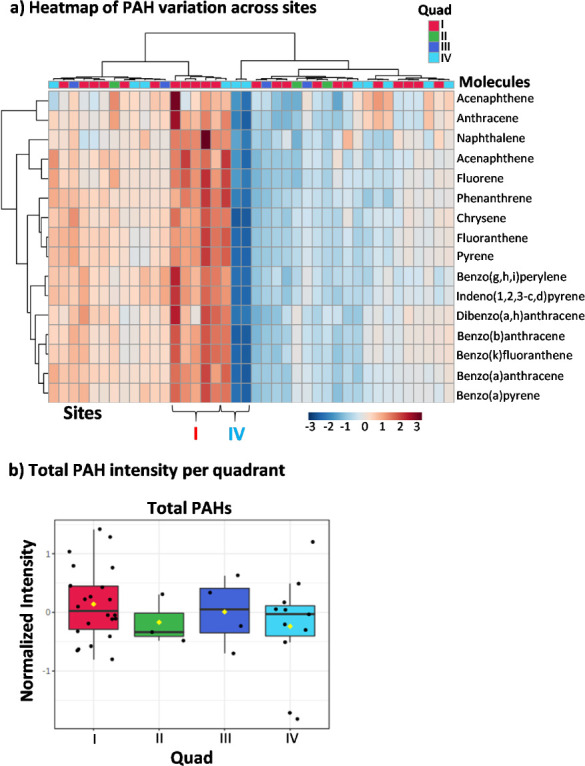
Figure 2.

Polycyclic aromatic hydrocarbon site and quadrant concentrations. a) Heatmap assessment of PAH concentration for each site illustrated 5 high concentration sites in Quad I and one in Quad IV, while both low concentration areas were in Quad IV. b) The total concentration and c) specific PAH molecule concentration per quadrant showed Quad I to have the highest concentrations, while Quad II was found to be have the lowest PAH concentration.
