
Figure 3.
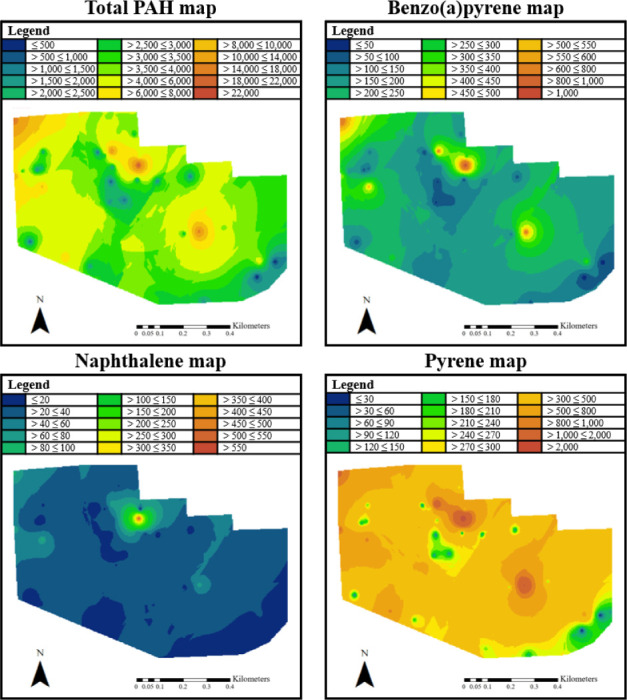
Spatial distribution of PAHs illustrates hot spots. Clockwise, the maps correspond to: total PAH concentration (top left), benzo(a)pyrene (top right), pyrene (bottom right) and naphthalene (bottom left), with all concentrations in ng/g.
Official websites use .gov
A
.gov website belongs to an official
government organization in the United States.
Secure .gov websites use HTTPS
A lock (
) or https:// means you've safely
connected to the .gov website. Share sensitive
information only on official, secure websites.
Spatial distribution of PAHs illustrates hot spots. Clockwise, the maps correspond to: total PAH concentration (top left), benzo(a)pyrene (top right), pyrene (bottom right) and naphthalene (bottom left), with all concentrations in ng/g.