Figure 5.

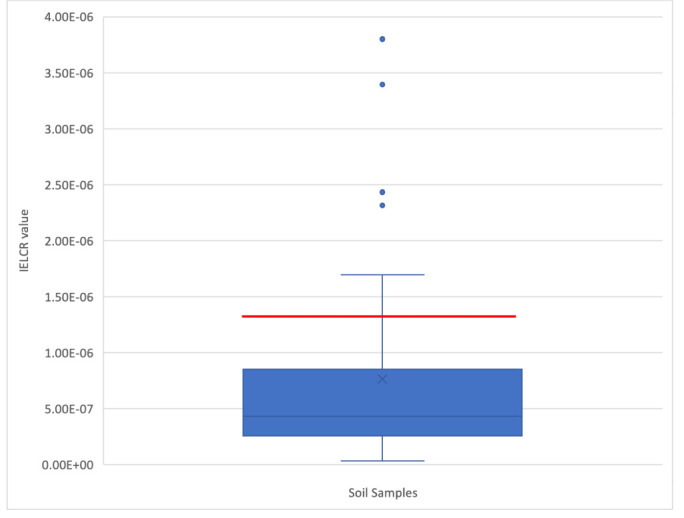
Box and whisker plot of IELCR values corresponding with soil samples collected from the Houston, Texas neighborhood of Manchester (N=40). The area delineated in red indicates an IELCR value of higher risk, as defined by the USEPA.51 IELCR

Box and whisker plot of IELCR values corresponding with soil samples collected from the Houston, Texas neighborhood of Manchester (N=40). The area delineated in red indicates an IELCR value of higher risk, as defined by the USEPA.51 IELCR