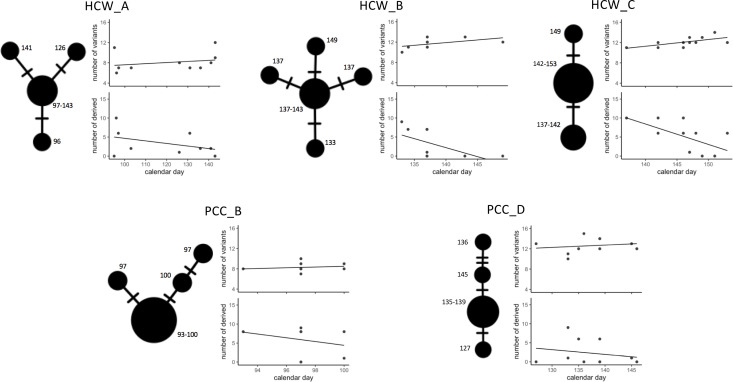
Figure 3. Temporal patterns in SARS-CoV-2 genomic similarity identify potential viral transmission pathways within patient contact clusters (PCCs) including healthcare worker (HCW) interactions.
For each of the highlighted contact clusters, a median joining network is presented with size of nodes representing number of samples and numbers indicating day of nasal or throat swab collection. The presented network suggests a possible path of viral transmission within each contact cluster, hatches represent single genomic variants that differ between viral clusters. The top scatterplot shows that the number of genomic variants identified against the MN908947.3 reference genome increases over time. The bottom scatterplot shows the number of other samples within the contact cluster that are identical or expected to be derived from samples collected at specific calendar days – these are defined as other samples that are identical but with the presence of additional genomic variants. The observed trends show that samples collected early during the suspected outbreaks have a greater number of derived or identical samples than those collected at a later day. These data support that the samples collected early during the highlighted contact clusters are early founder events during a nosocomial outbreak.

