Figure 1. Experimental/computational pipeline to analyze heterogeneous adhesion dynamics in ChoK1 cells.
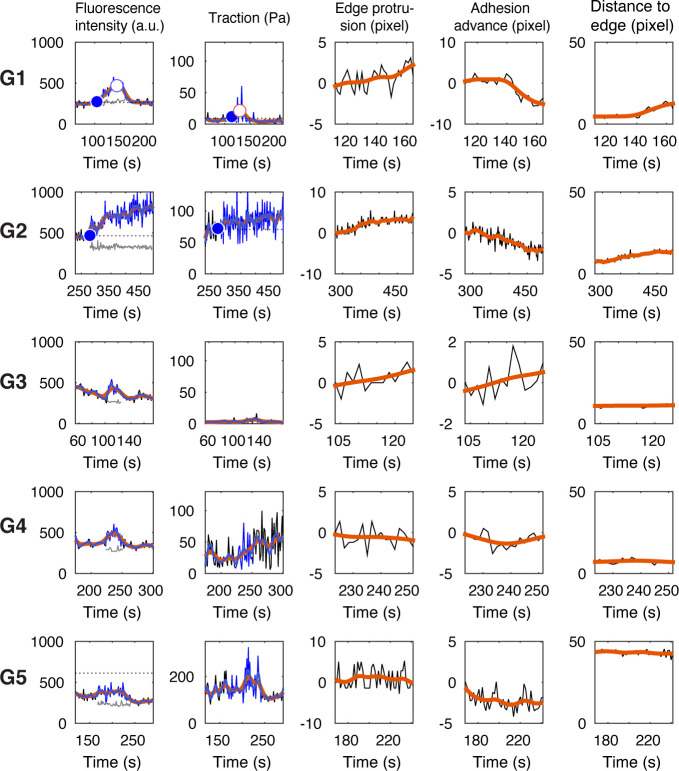
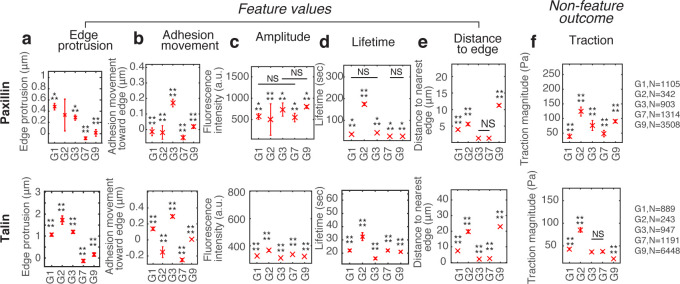
(a–c) High-resolution traction maps co-imaged with mGFP-tagged adhesion protein, talin (d), vinculin (e), and paxillin (f). 5 kPa silicone gel coated with high density beads was used as a TFM substrate. (g) Trajectories of individual nascent and focal adhesions overlaid on a region of interest cropped from (e). Tracking is based on all detected point sources, (red circles). Big segmented focal contacts/adhesions (orange, closed freeform overlays) were used as additional information for feature selection. (h) Some of the key features used for supervised classification, tabulated in Supplementary file 1A. (i) Classification of adhesion trajectories into nine different groups, overlaid on the adhesion image. Five different NA groups, three FA groups and one noise group were distinguished by the support vector machine classifier. (j–m) Comparison of feature values among the five NA groups, G1, G2, G3, G4, and G5: edge protrusion speed (j), adhesion movement speed, positive when sliding toward protruding edge (k), mean intensity (l), and lifetime (m), extracted from six vinculin-tagged cells. All features show a significant shift in value for at least one subgroup. (n) Average traction magnitude, read from traction map, at individual NA trajectories per each group. The number of samples per each group is shown in the lower right corner of the figure.
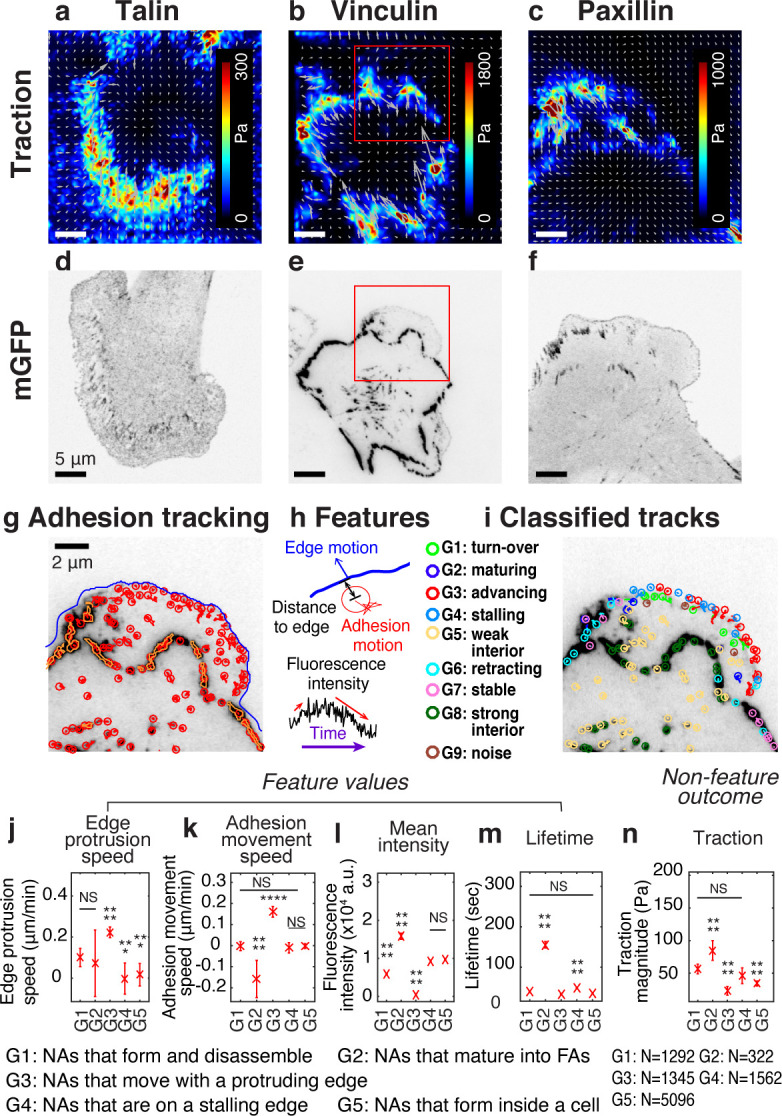
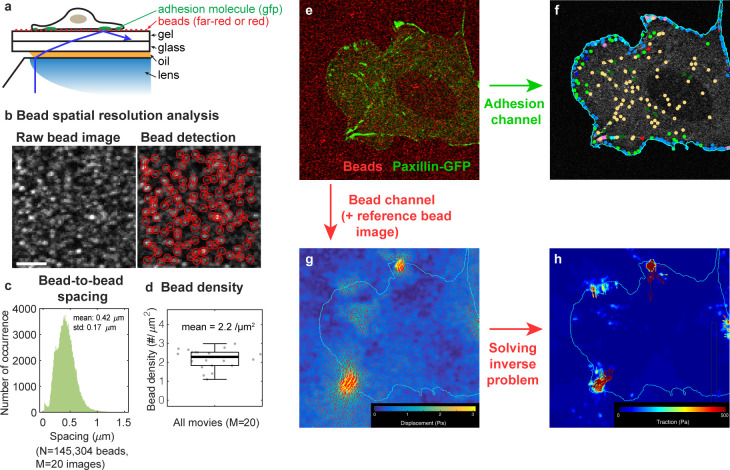
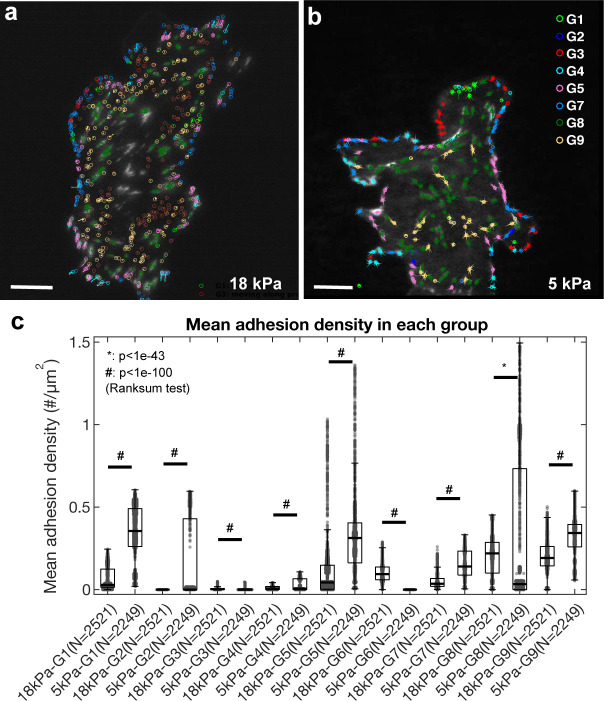
Figure 1—figure supplement 1. Simultaneous TFM-adhesion experimental approach.
Figure 1—figure supplement 2. Overall average traction per cell and cell spreading area did not change with expression of talin-GFP, vinculin-GFP, or paxillin-GFP.
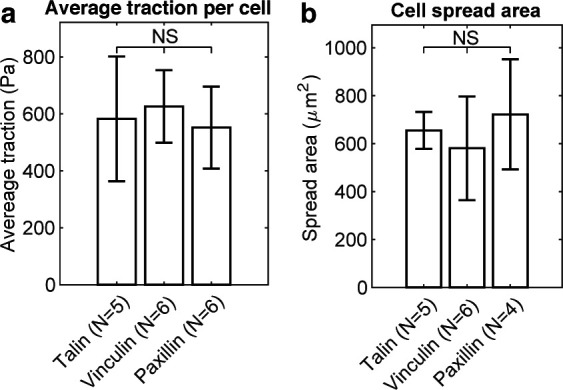
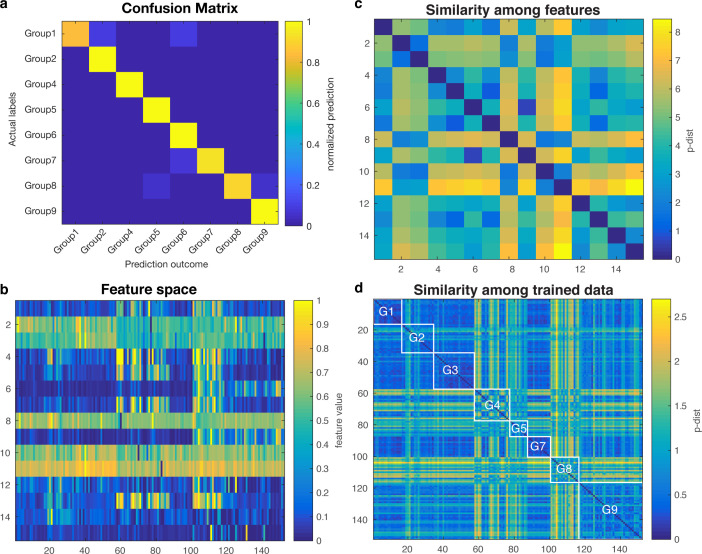
Figure 1—figure supplement 3. Validation of SVM-based machine learning.
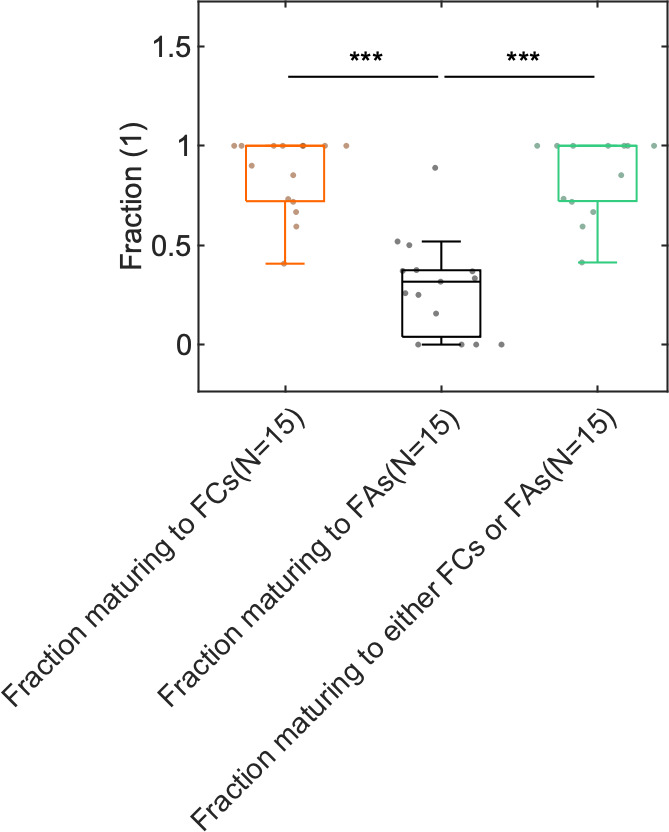
Figure 1—figure supplement 4. Boxplot of the fraction of G2 NAs that mature into FCs, FAs, or either FCs and FAs.
