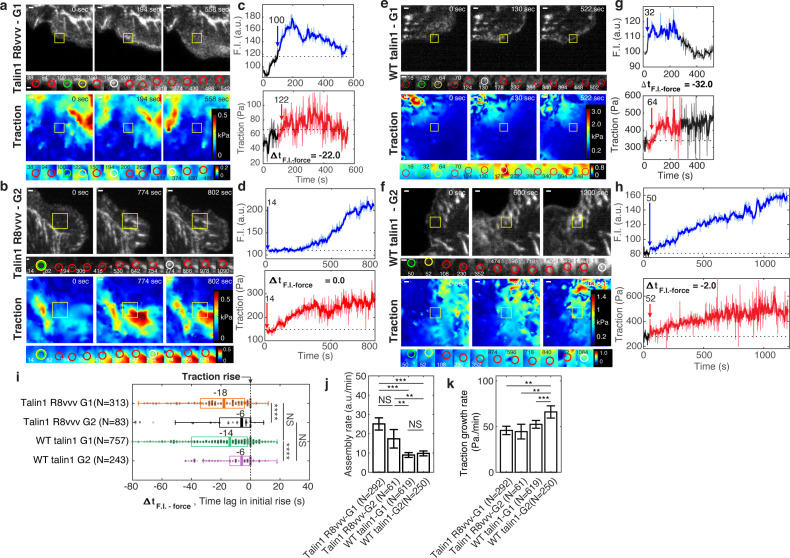
Figure 6. Expression of talin1 R8vvv-mNG mutant does not change the recruitment timing of talin to NAs, but reduces the force growth rate in NAs.
(a–h) Representative talin (top) and traction force (bottom) images of talin1 R8vvv-mNG expressing cells (a–d) and WT talin-mNG rescue cells (e–h) within non-maturing (a,c,e,g) and maturing (b,d,f,h) NAs. (a,b,e,f) talin-mNG images (top) and traction images (bottom) of three different time points, that is at initial nucleation, at maximum fluorescence intensity, and at the end of the NA portion of the track. Yellow boxes indicate positions of example adhesions whose fluorescent signals and traction levels are shown in time lapse montages with finer resolution underneath. Green circles indicate the time points of initial talin signal rise, yellow circles show the time points of initial traction rise, and white circles show the time of the peak amplitude. Red circles show normal default detections without special events. Scale bar: 1 µm. (c–d, g–h) Traces of talin-mNeonGreen fluorescence intensity (top) and traction (bottom). Phases of the traces with significant fluorescence above background are indicated in blue and red, respectively. The black time series outside the colored signal are the background-subtracted intensities read at the first or last position detected by the particle tracker. Blue and red arrows mark the time points of the first intensity increase and the first traction increase, respectively (i–k) Distributions of time lags of fluorescence intensity onset relative to traction onset (i), talin assembly rates (j), and traction growth rates (k) of non-maturing (G1) and maturing (G2) NAs in talin1 R8vvv-mNG mutant and WT talin1-mNG rescue cells. Time integration time for calculating slopes in j and k was 20 and 60 s, respectively. *p<1×10⁻², **p<1×10⁻³, ***p<1×10⁻¹⁰, ****p<1×10⁻³⁰ by Mann-Whitney U test.


