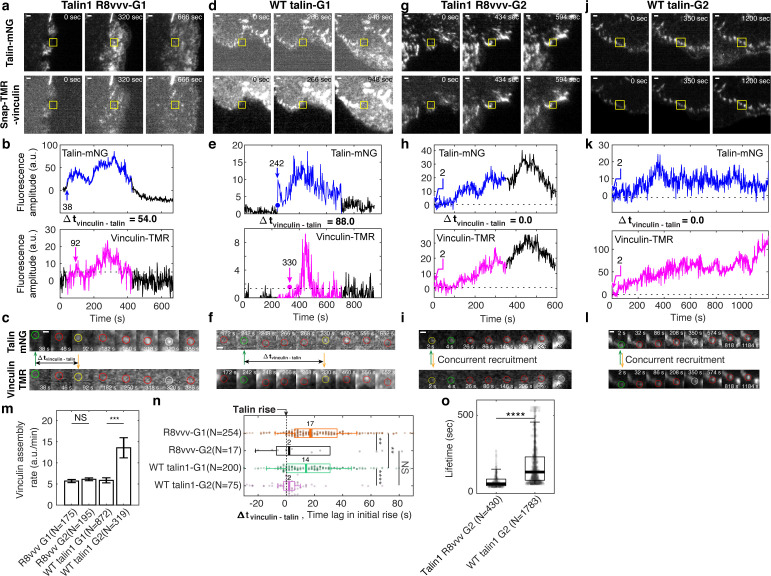
Figure 7. Vinculin recruitment is reduced in talin1 R8vvv mutant cells.
(a,d,g,j) Representative two-channel time-lapse images of talin-mNeonGreen (top) and vinculin-SnapTag-TMR-Star (bottom) of G1 NA in a Talin1 R8vvv mutant cell (a), G1 NA in WT talin1 rescue cell (d), G2 adhesion in a Talin1 R8vvv mutant cell (g), and G2 adhesion in WT talin1 rescue cell (j). NAs of interest are indicated with a yellow box. Scale bar: 1 μm. (b–k) Time series of talin-mNeonGreen amplitude (top) and vinculin-SnapTag-TMR-Star amplitude (bottom) of G1 non-maturing (b,e) and G2 maturing (h,k) NAs in cells expressing the talin1 R8vvv mutant (b,h) and WT talin (e,k) constructs. Colored time periods (blue for talin, magenta for vinculin) indicate the phases where the adhesion is detected as a significant particle of robust trackability. The black time series outside the colored signal are the background-subtracted intensities read at the first or last position detected by the particle tracker. Blue and magenta arrows and the text around them indicate the time of talin and vinculin recruitment onset, respectively. (c,f,k,l) Time lapse montages of individual NAs shown in a, d, g, and j, respectively, overlaid with colored circles as detected centers of NAs of interest. Green circle represents the time point of initial talin signal rise, yellow the time point of initial vinculin signal onset, white the time of the peak amplitude, while red circles show normal default detections without special events. Talin and vinculin’s initial recruitments are indicated with green and yellow arrows to highlight the time delay occurring between talin and vinculin in G1 adhesions and the concurrent recruitment in G2 adhesions, regardless of R8vvv mutations. (m) Vinculin assembly rates at non-maturing and maturing NAs in R8vvv mutant and WT talin rescue cells, quantified by the slope of vinculin-SnapTag-TMR-Star fluorescence intensity over the initial 20 s after the first detection in the talin-mNeonGreen channel. (n) Time delays of vinculin recruitment onset relative to talin recruitment onset of non-maturing vs. maturing NAs in talin1 R8vvv-mNG mutant and WT talin1 mNG cells. Vinculin recruitment onsets in non-maturing NAs are positive, that is, vinculin recruitment starts after talin. In contrast, vinculin recruitment onsets in maturing NAs are nearly coincidental with talin. See the text for further description. (o) Lifetimes of maturing NAs classified in talin1 R8vvv mutant and WT talin1 mNG rescue cells. ****p<1×10⁻¹⁵, **p<0.05 by Mann-Whitney U test. The numbers of adhesions (N), extracted from seven cells each for cells with talin1 R8vvv-mNG and WT talin1-mNG, are shown per each condition name at each panel.

