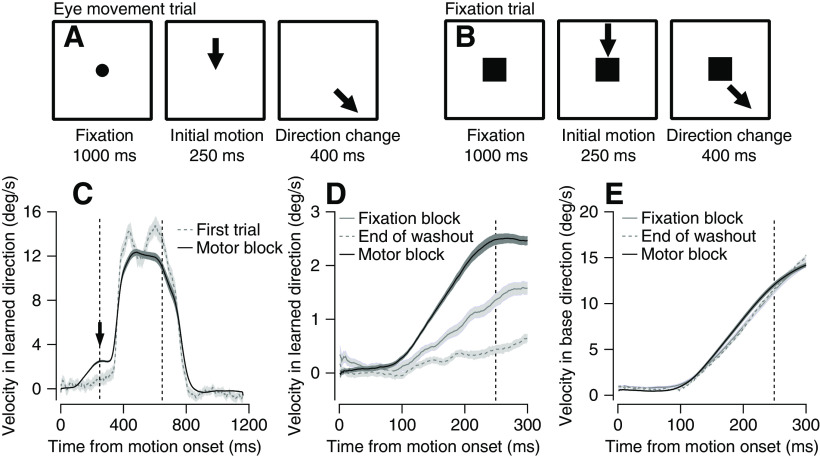
Figure 1.
Trial schematics and behavior in motor and fixation blocks. A, B, Schematics of the eye movement (A) and fixation (B) trials. Arrows show the direction of target motion, circle represents the target before motion onset, and squares represent the fixation target. C, Average eye movement in the learned direction on the first trial of learning (dashed gray trace) and postlearning trials (50th to 100th trial) averaged across all motor blocks (black). D, E, Average eye movement in the learned (D) and base (E) directions at the end of washout blocks (25 last eye movement trials, dashed gray) and after learning on motor blocks (50th to 100th trial averaged across all motor blocks, solid black) and fixation blocks (5th to 10th eye movement trials averaged across all congruent fixation blocks, solid gray). In all traces, shadowing represents SEM. Vertical dashed lines show the time of the change of direction (250 ms) and end of target motion (650 ms).

