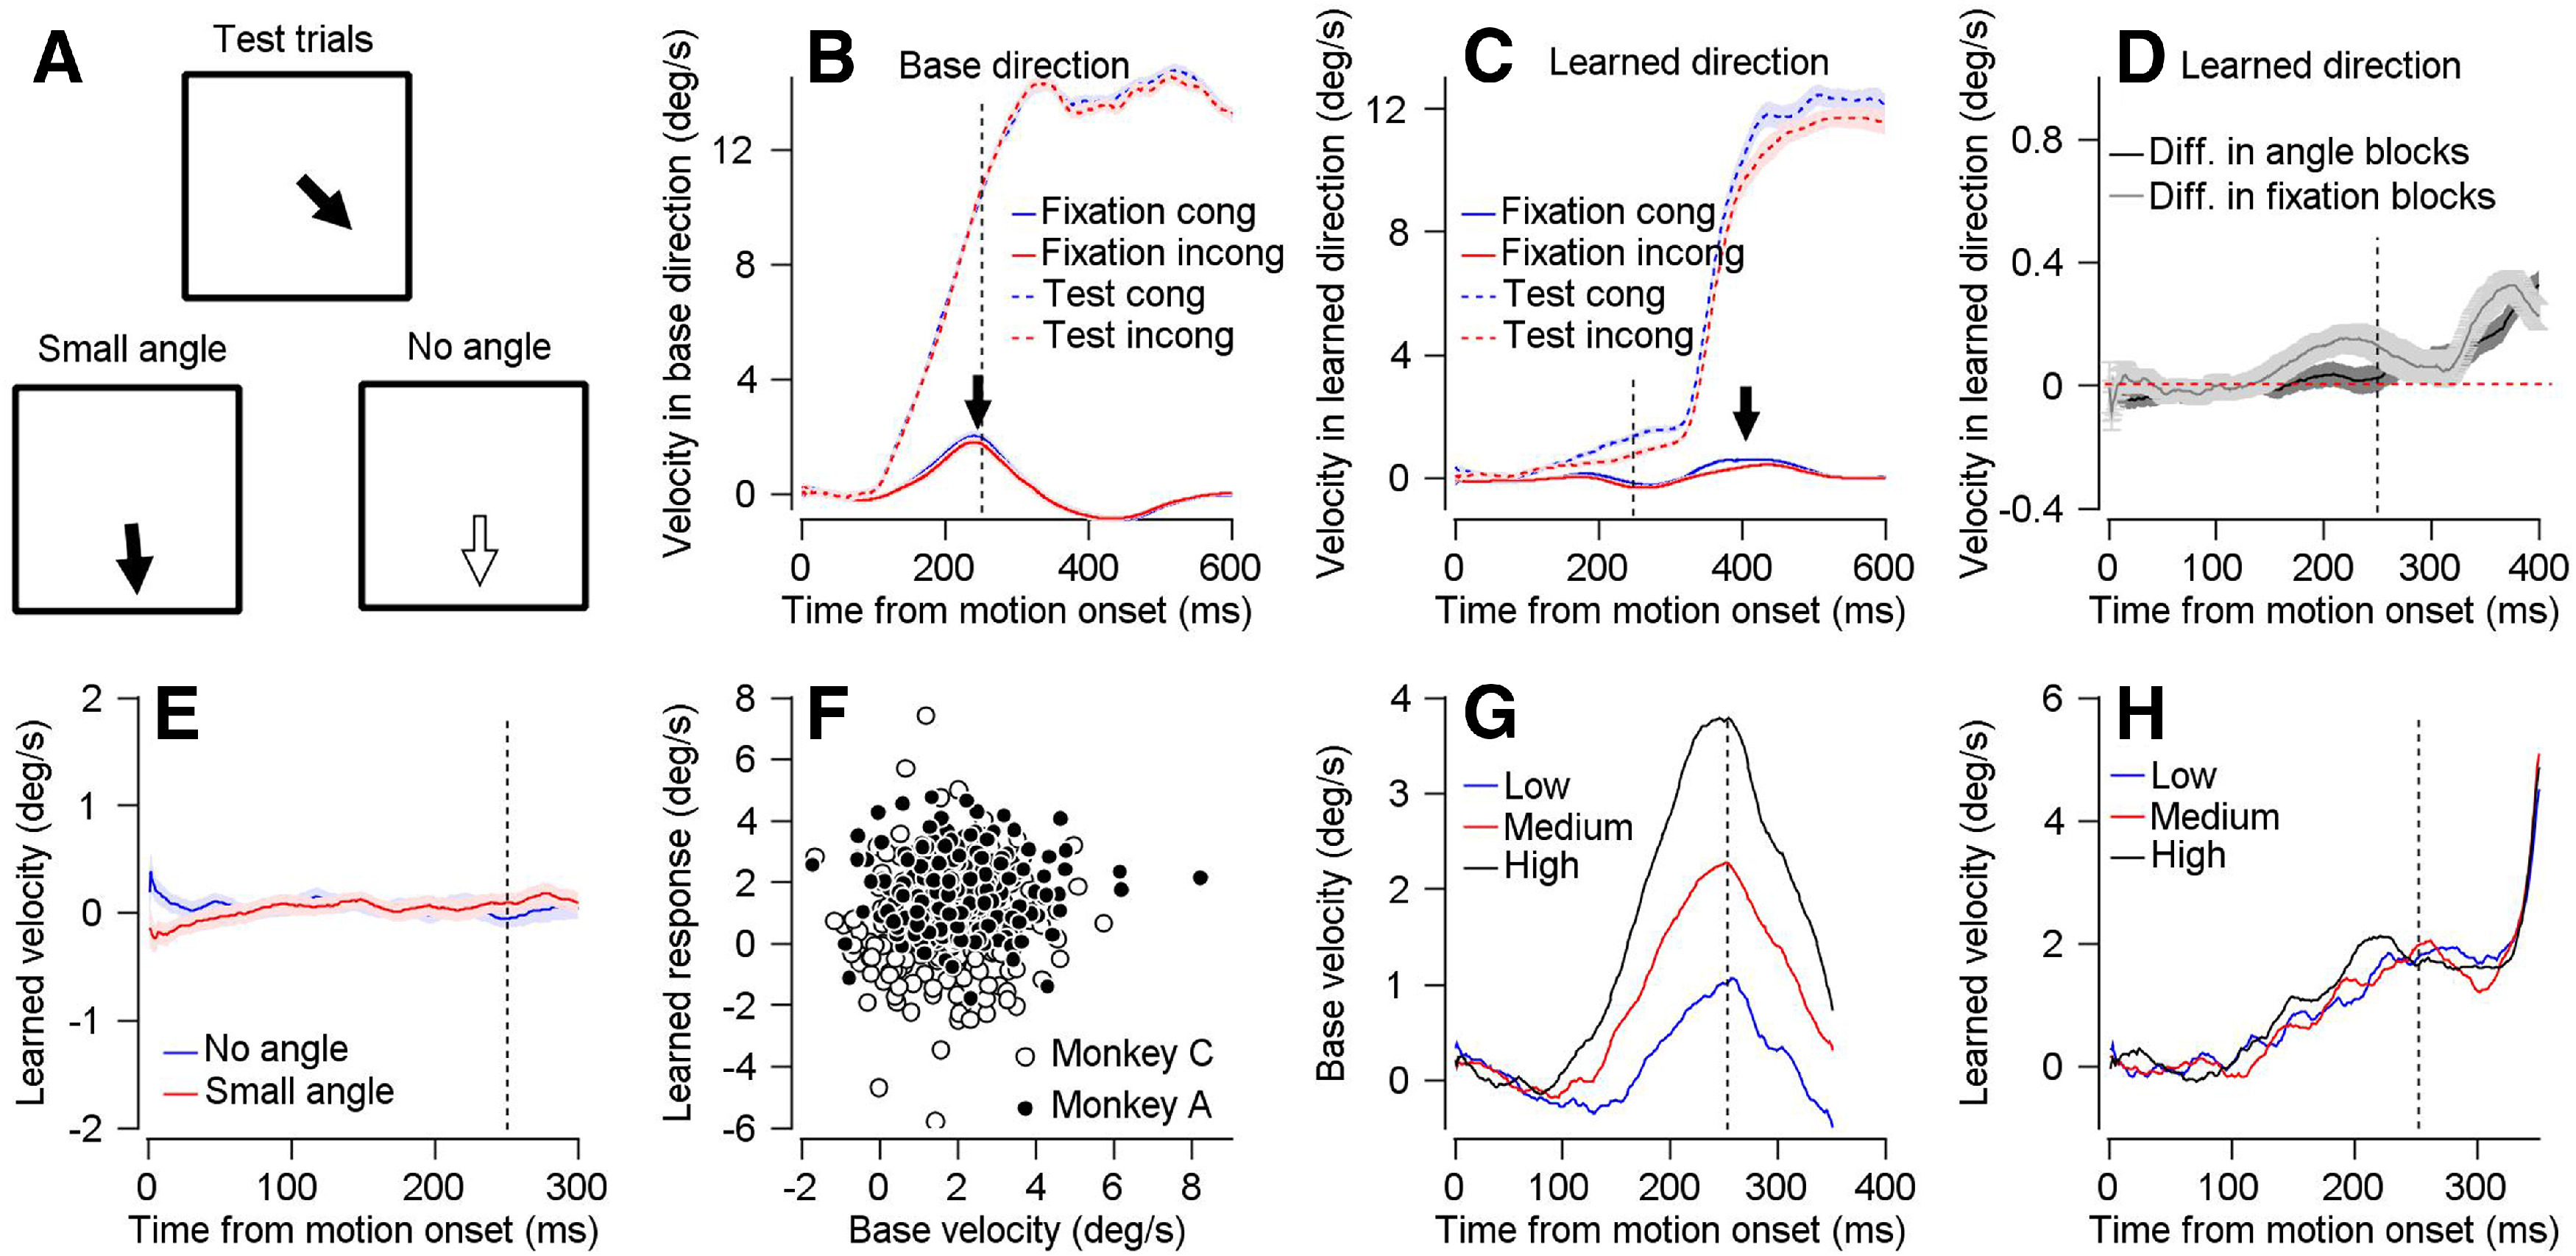
Figure 3.

Learning is not driven by residual movement on fixation trials. A, Schematics showing the direction of motion change on trials with large (top), small (bottom left) and no change (bottom right) in target direction. B, C, Eye velocity in base (B) and learned (C) direction as a function of time from motion onset on fixation (solid trace) and test (dashed trace) trials. Blue and red traces show the velocity averaged across congruent and incongruent fixation blocks. D, Difference in learned eye velocity between fixation trials from congruent and incongruent blocks (gray) and difference between trials with small and no angle in the corresponding blocks (black). Dashed red line indicates null velocity. E, Average learned eye velocity as a function of time from motion onset in test trials in blocks without change in direction (blue) and with a small change in direction (red). F, Base velocity on fixation trials, average from 200 up to 300 ms after motion onset versus learned response in subsequent test trials in fixation congruent blocks. Filled and open symbols show data from Monkeys A and C. G, H, Base velocity on fixation trials (G) and learned velocity on eye movement trials (H) in fixation congruent blocks as a function of time from motion onset for group of fixation trials with low, medium, and high base velocities (blue, red, and black traces). In all traces, shadowing represents the SEM. Vertical dashed line shows the time of the change in direction of the moving target.
