Figure 1.

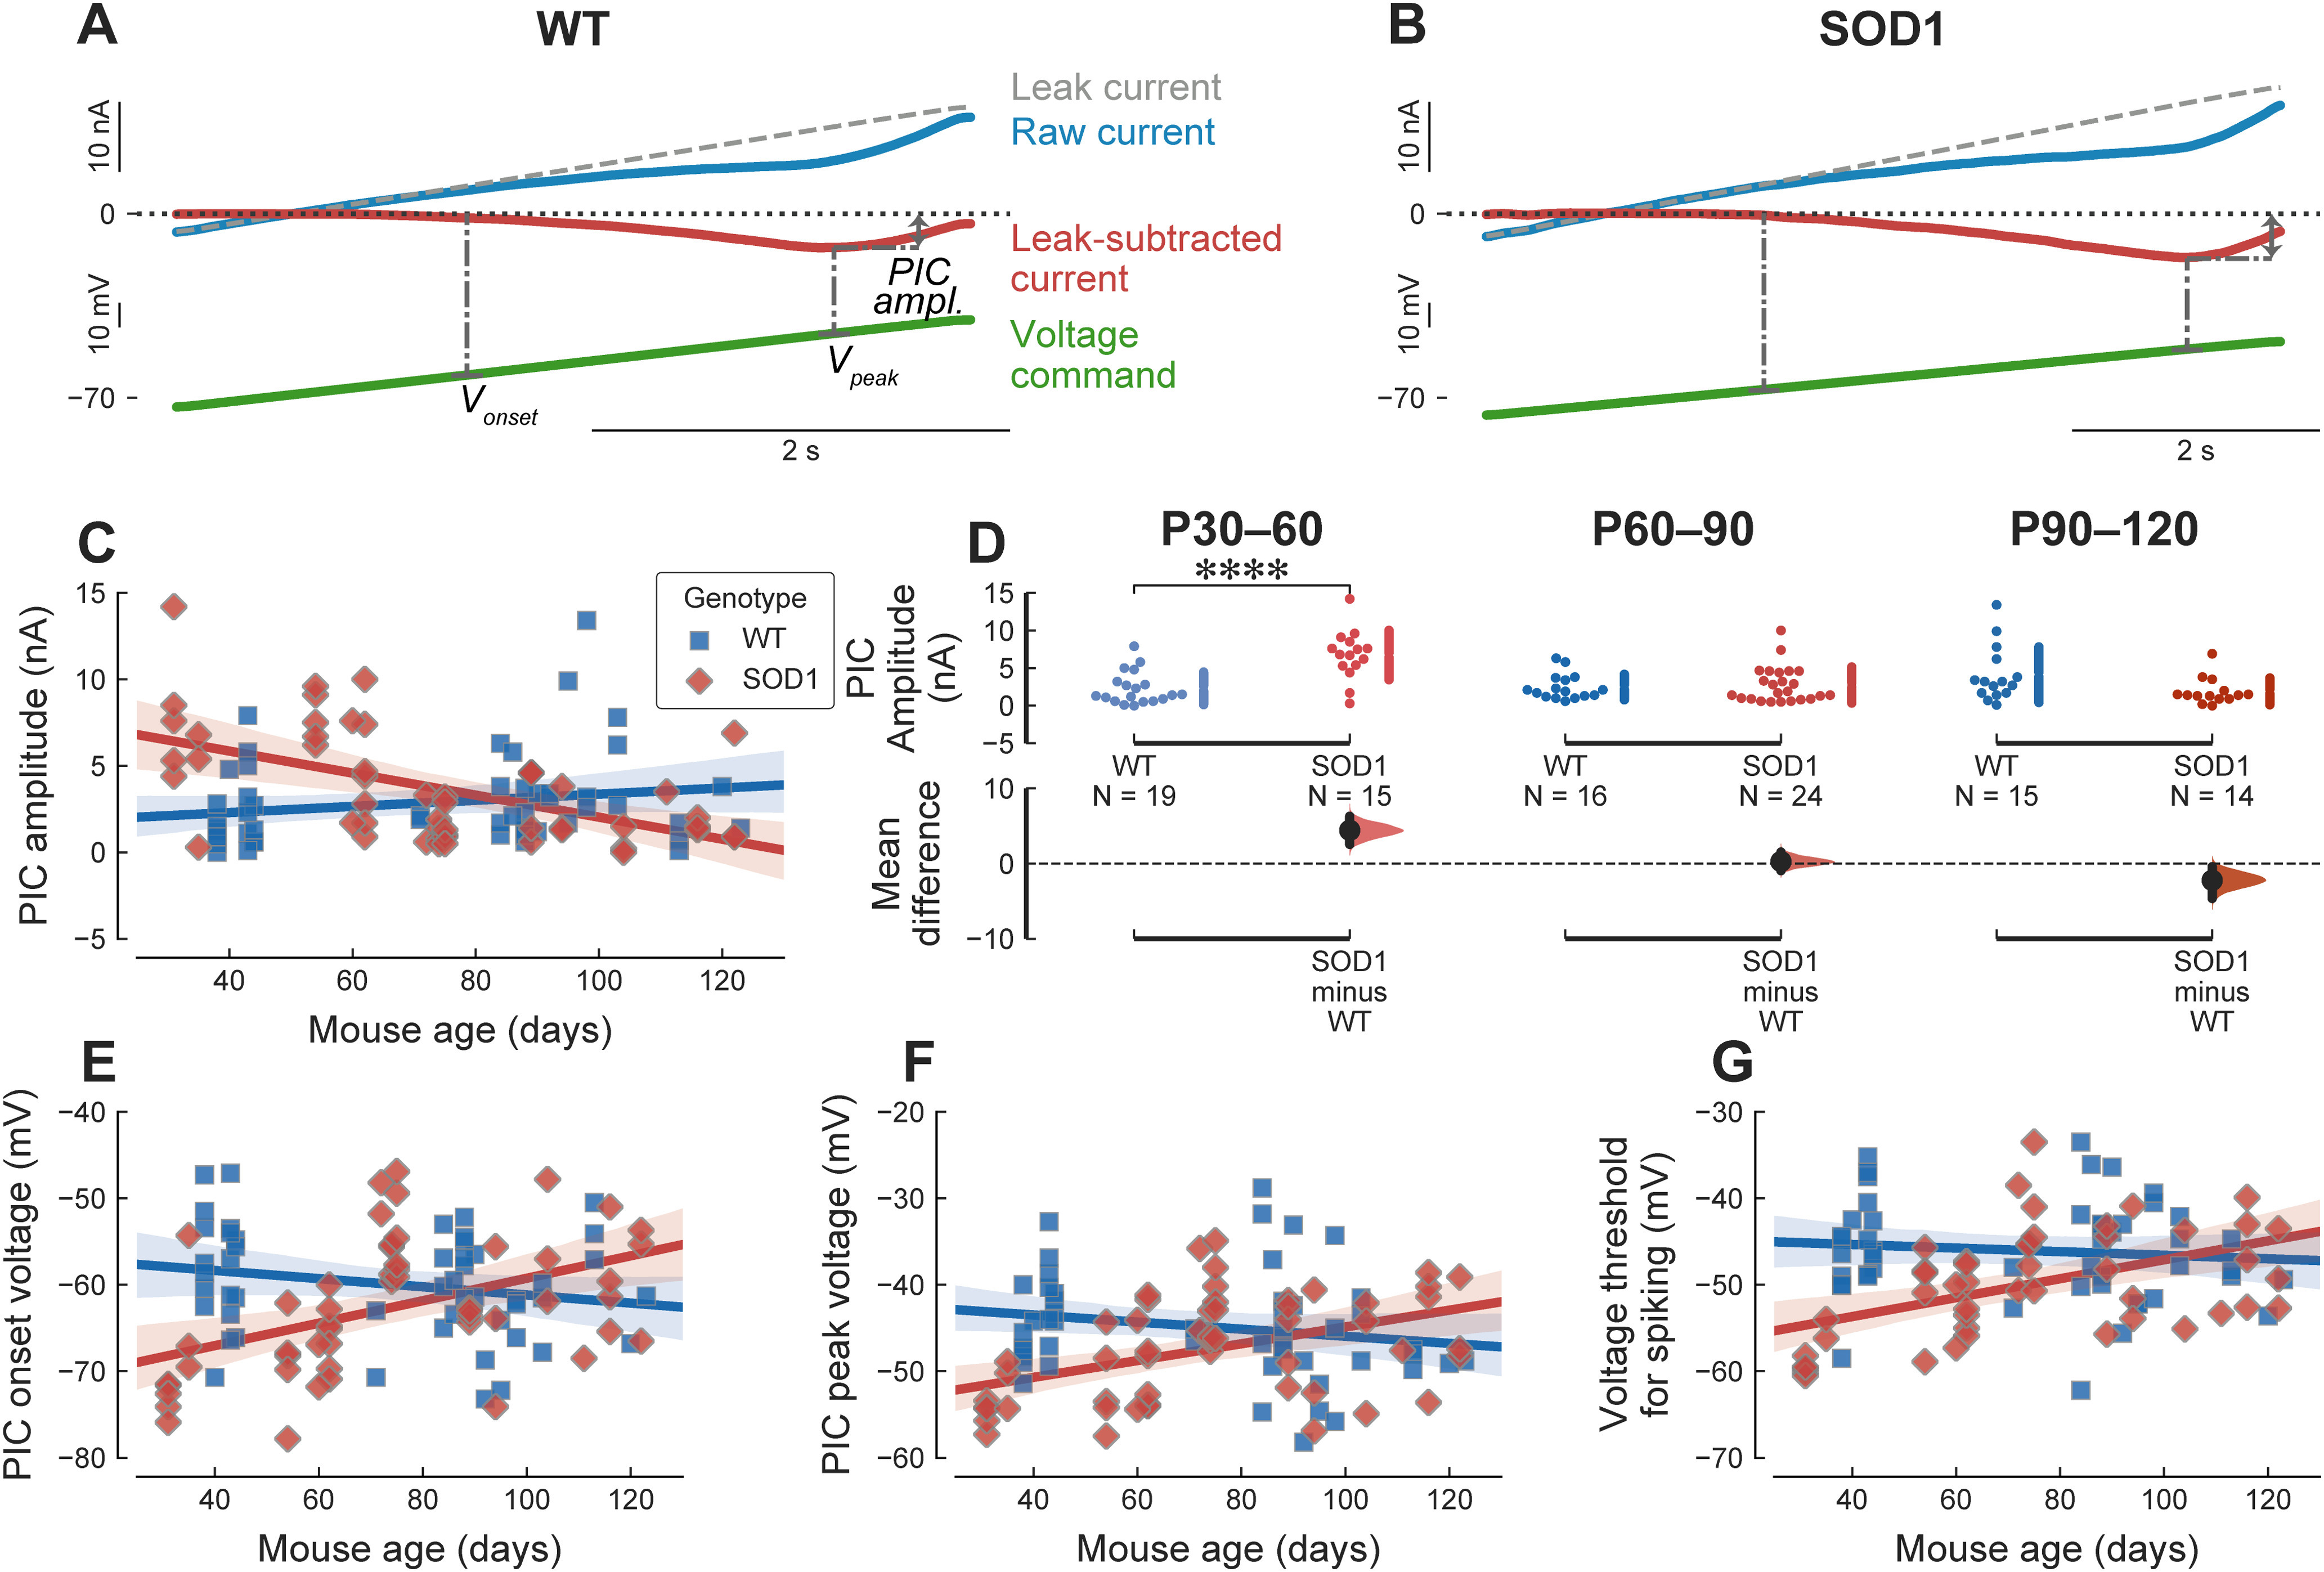
PIC amplitude is larger is young adult mSOD1 mice. A, Example of a PIC recording from a P43 WT mouse. The green bottom trace is the ascending part of the voltage ramp. The top blue trace is the raw current. The dashed line shows the leak current estimated by fitting a straight line in the subthreshold potential region, which is used to measure the input conductance of the cell. The leak-subtracted current trace is obtained by subtracting the leak current from the raw current trace. The dash-dotted lines show some of the measurements: PIC amp.: PIC amplitude, measured at the point of largest deflection on the leak-subtracted trace; Vonset: voltage at which the PICs start to activate; Vpeak: voltage at which PICs reach their maximum. B, Example of a PIC recording from a P35 mSOD1 mouse. Same organization as in A. C, Plot of the amplitude of the PICs (in nA) versus age in WT (blue square) and mSOD1 mice (red diamonds). The solid lines correspond to the linear regression lines with 95%CIs (shaded areas). WT: slope = 0.12 nA/wk 95%CI[−0.068–0.32], r2 = 0.034 (p = 0.2); SOD1: slope = −0.45 nA/wk 95%CI[−0.64–−0.25], r2 = 0.29 (p = 3.4e−05). D, Breakdown of the difference in PIC amplitude between WT and mSOD1 animals by age groups. P30–P60 WT: 2.30 ± 2.17 nA, N = 19 versus mSOD1: 6.73 ± 3.28 nA, N = 15; g = 1.59 95%CI[0.63–2.45]; t(32) = −4.50, ****p = 0.00016. P60–P90 WT: 2.47 ± 1.69 nA, N = 16 versus mSOD1: 2.75 ± 2.40 nA, N = 24; g = 0.12 95%CI[−0.53–0.65]; t(38) = −0.42, p = 0.67. P90–P120 WT: 4.12 ± 3.69 nA, N = 15 versus mSOD1: 1.90 ± 1.78 nA, N = 14; g = −0.74 95%CI[−1.26–0.01]; t(27) = 2.08, p = 0.05. E, Evolution of the membrane potential at which the PICs start to activate (PIC onset voltage) versus age. WT: slope = −0.33 mV/wk 95%CI[−0.77–0.11], r2 = 0.045 (p = 0.14). SOD1: slope = 0.91 mV/wk 95%CI[0.41–1.4], r2 = 0.21 (p = 0.00063). F, Evolution of the membrane potential at which the PICs reach their peak (PIC peak voltage) versus age. WT: slope = −0.29 mV/wk 95%CI[−0.73–0.16], r2 = 0.034 (p = 0.2). SOD1: slope = 0.68 mV/wk 95%CI[0.28–1.1], r2 = 0.18 (p = 0.0014). G, Evolution of the voltage threshold for spiking (measure in current-clamp mode) versus age. WT: slope = −0.14 mV/wk 95%CI[−0.57–0.28], r2 = 0.0096 (p = 0.5). SOD1: slope = 0.77 mV/wk 95%CI[0.34–1.2], r2 = 0.23 (p = 0.0007).
