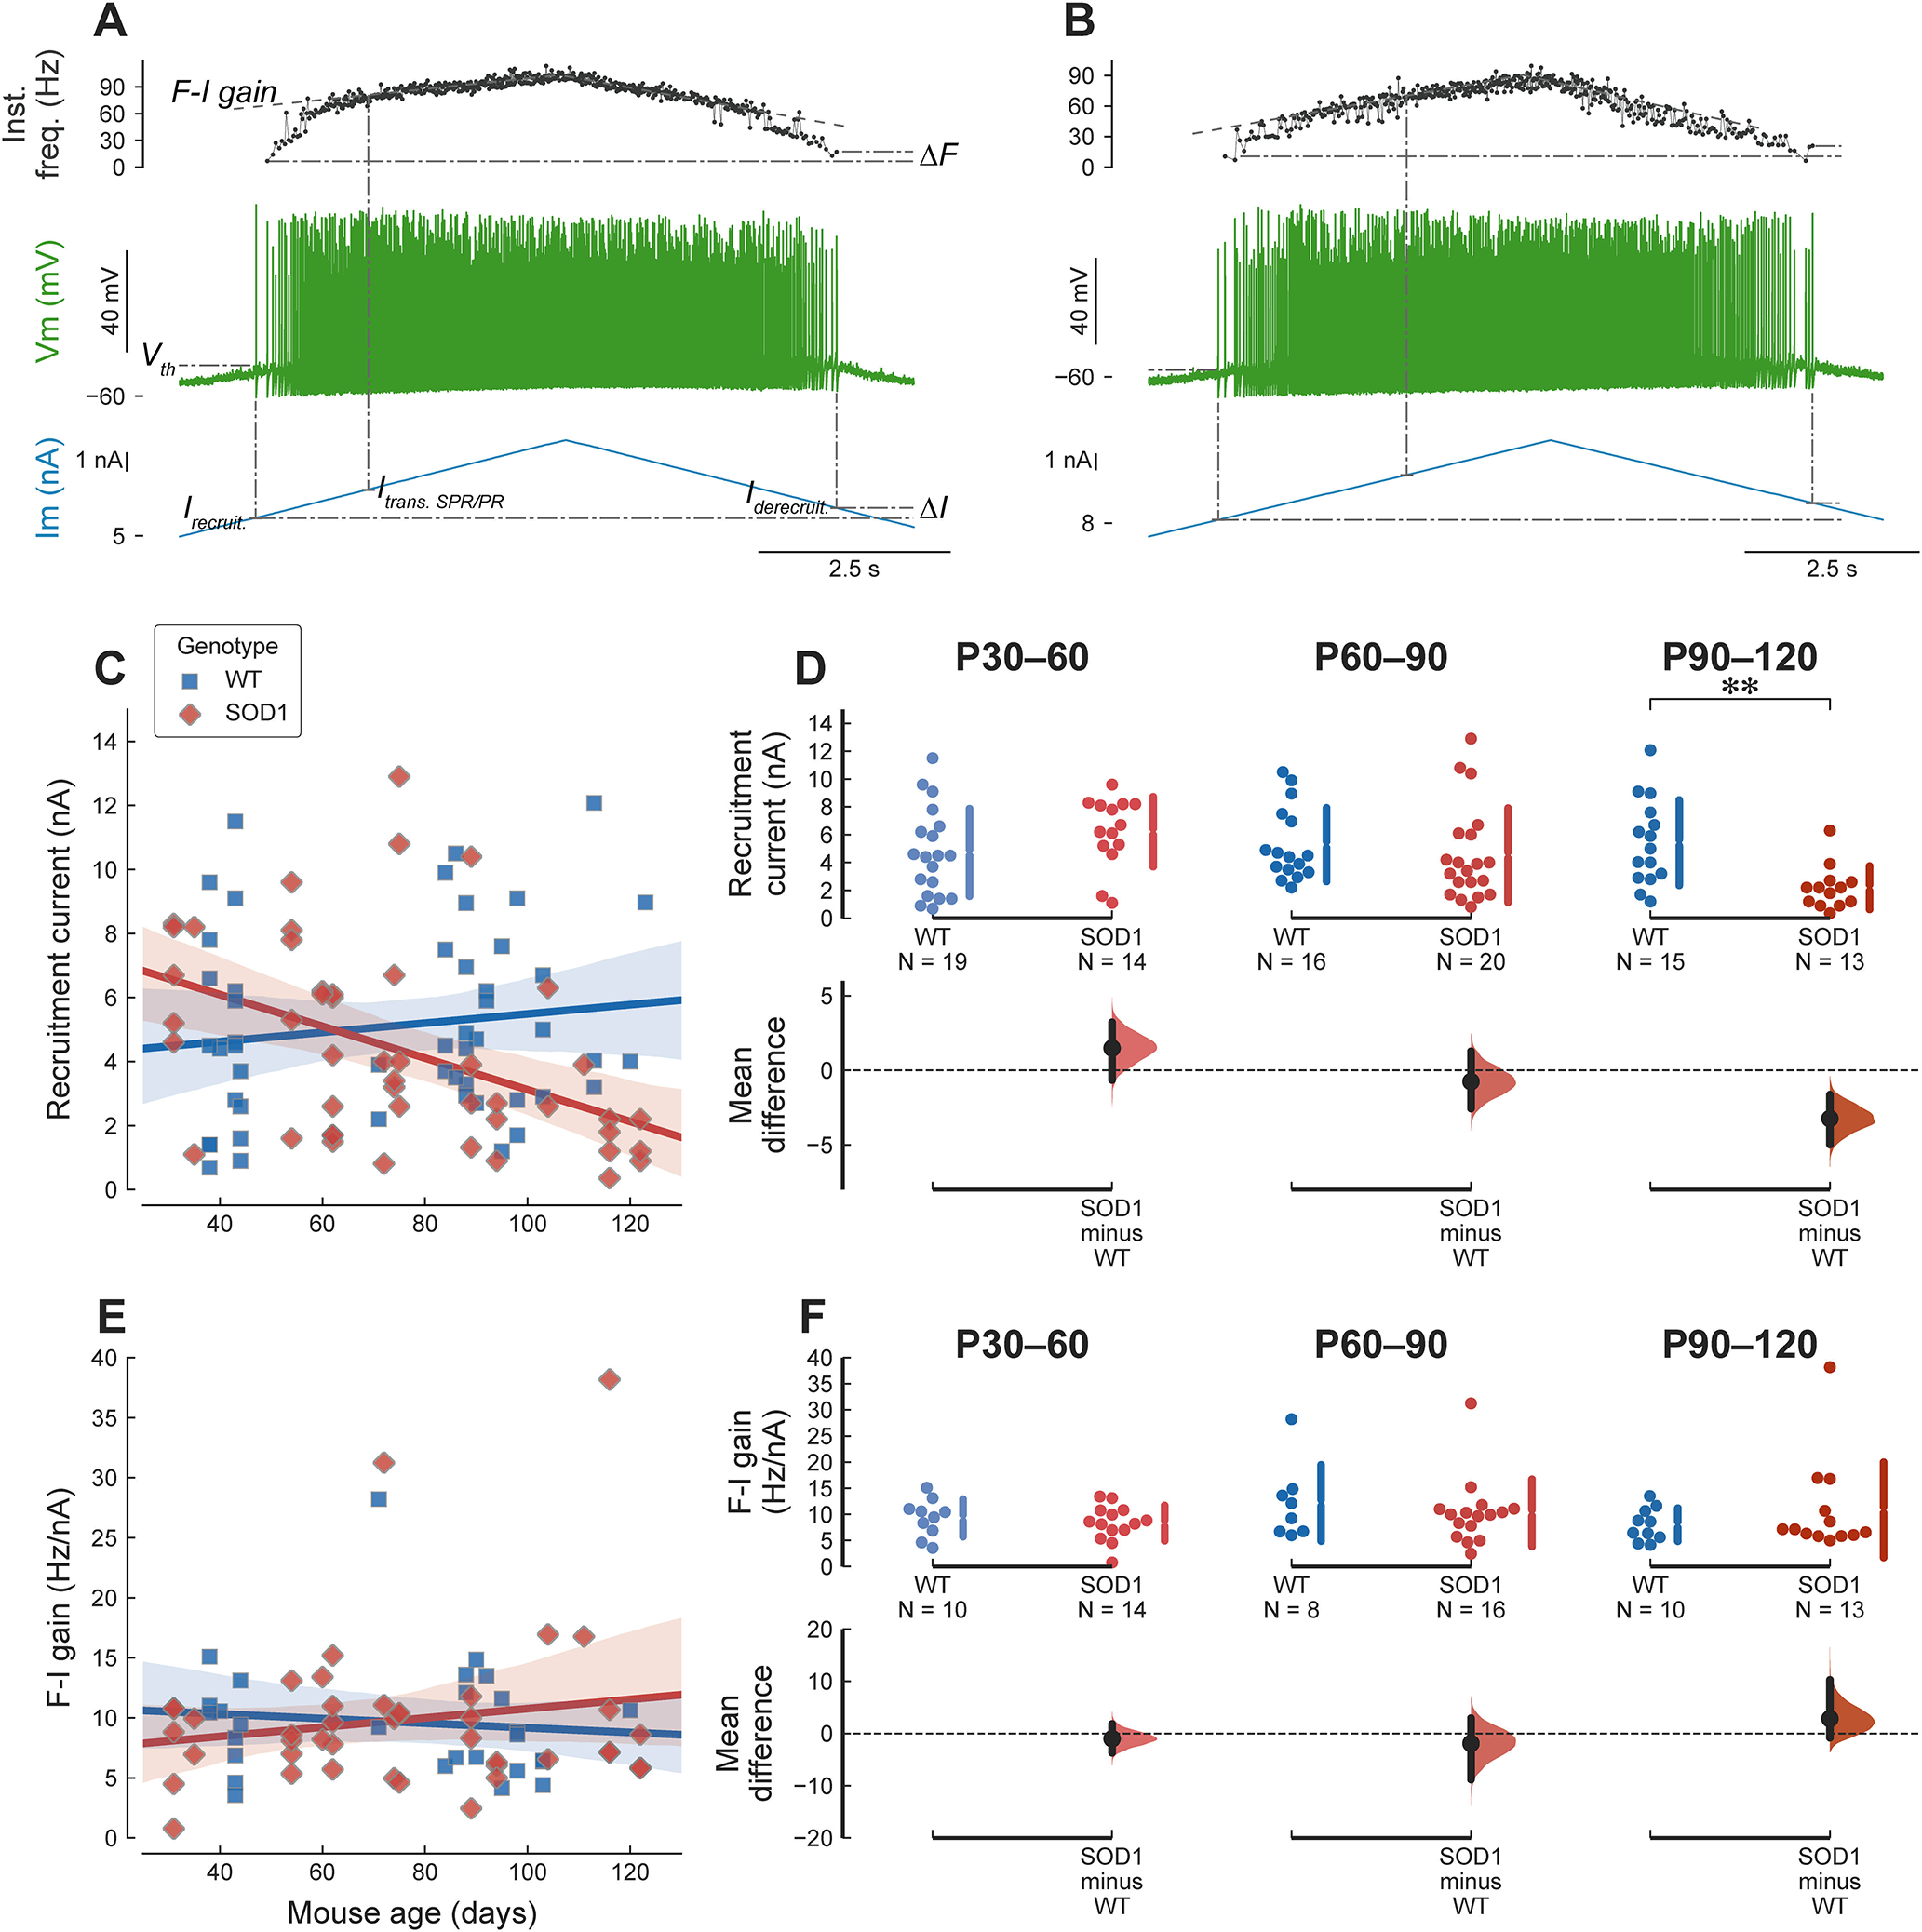
Figure 2.

Mutant motoneurons are not hyperexcitable. A, Example of the response of a P43 WT mouse (same motoneuron as in Fig. 1A) to a triangular ramp of current. From bottom to top, traces are: injected current, membrane potential, and instantaneous firing frequency. The dash-dotted lines show some of the measurements: Irecruit.: current intensity at which the motoneuron starts to fire; Iderecruit.: de-recruitment current; ΔI: difference between the de-recruitment and recruitment currents; Itrans. SPR/PR: the current at the transition between SPR and PR; F-I gain: slope of the linear fit of the firing frequency in the PR; ΔF: difference between the instantaneous firing frequency at de-recruitment and recruitment; Vth: voltage threshold for spiking measured on the first spike of the ramp. B, Example of the response of a P35 mSOD1 mouse (same motoneuron as in Fig. 1B). Same organization as in A. C, Plot of the current intensity required for eliciting the first spike on a triangular ramp of current in WT (blue squares) and mSOD1 motoneurons (red diamonds). WT: slope = 0.1 nA/wk 95%CI[−0.11–0.31], r2 = 0.019 (p = 0.34). SOD1: slope = −0.35 nA/wk 95%CI[−0.56–−0.14], r2 = 0.2 (p = 0.0019). D, Breakdown of the difference in recruitment current between WT and mSOD1 motoneurons in each of the age groups. In young adult and presymptomatic mice, mutant motoneurons require the same amount of current than WT motoneuron to fire, P30–P60 WT: 4.73 ± 3.14 nA, N = 19 versus mSOD1: 6.21 ± 2.51 nA, N = 14; g = 0.50 95%CI[−0.24–1.24]; t(31) = −1.51, p = 0.14. P60–P90 WT: 5.28 ± 2.64 nA, N = 16 versus mSOD1: 4.53 ± 3.38 nA, N = 20; g = −0.24 95%CI[−0.93–0.41]; t(34) = 0.75, p = 0.46. At the symptomatic stages (P90–P120), mutant motoneurons exhibit a lower current threshold for firing (WT: 5.43 ± 3.07 nA, N = 15 versus mSOD1: 2.19 ± 1.56 nA, N = 13; g = −1.26 95%CI[−1.95–−0.47]; t(26) = 3.59, **p = 0.0017), compatible with the loss of the least excitable cells. E, The slope of the F-I relationship, measured over the PR, is not affected by the mutation, regardless of the age of the animals. WT: slope = −0.13 Hz/nA/wk 95%CI[−0.65–0.38], r2 = 0.011 (p = 0.6). SOD1: slope = 0.27 Hz/nA/wk 95%CI[−0.23–0.77], r2 = 0.028 (p = 0.28). F, Breakdown of the difference between WT and mSOD1 motoneurons by age group: P30–P60 WT: 9.3 ± 3.6 Hz/nA, N = 10 versus mSOD1: 8.3 ± 3.4 Hz/nA, N = 14; g = −0.28 95%CI[−1.10–0.64]; t(22) = 0.69, p = 0.5. P60–P90 WT: 12.2 ± 7.3 Hz/nA, N = 8 versus mSOD1: 10.3 ± 6.4 Hz/nA, N = 16; g = −0.27 95%CI[−1.22–0.54]; t(22) = 0.62, p = 0.54. P90–P120 WT: 8.0 ± 3.2 Hz/nA, N = 10 versus mSOD1: 10.8 ± 9.1 Hz/nA, N = 13; g = 0.38 95%CI[−0.43–0.93]; t(21) = −1.04, p = 0.31.
