
Figure 5.
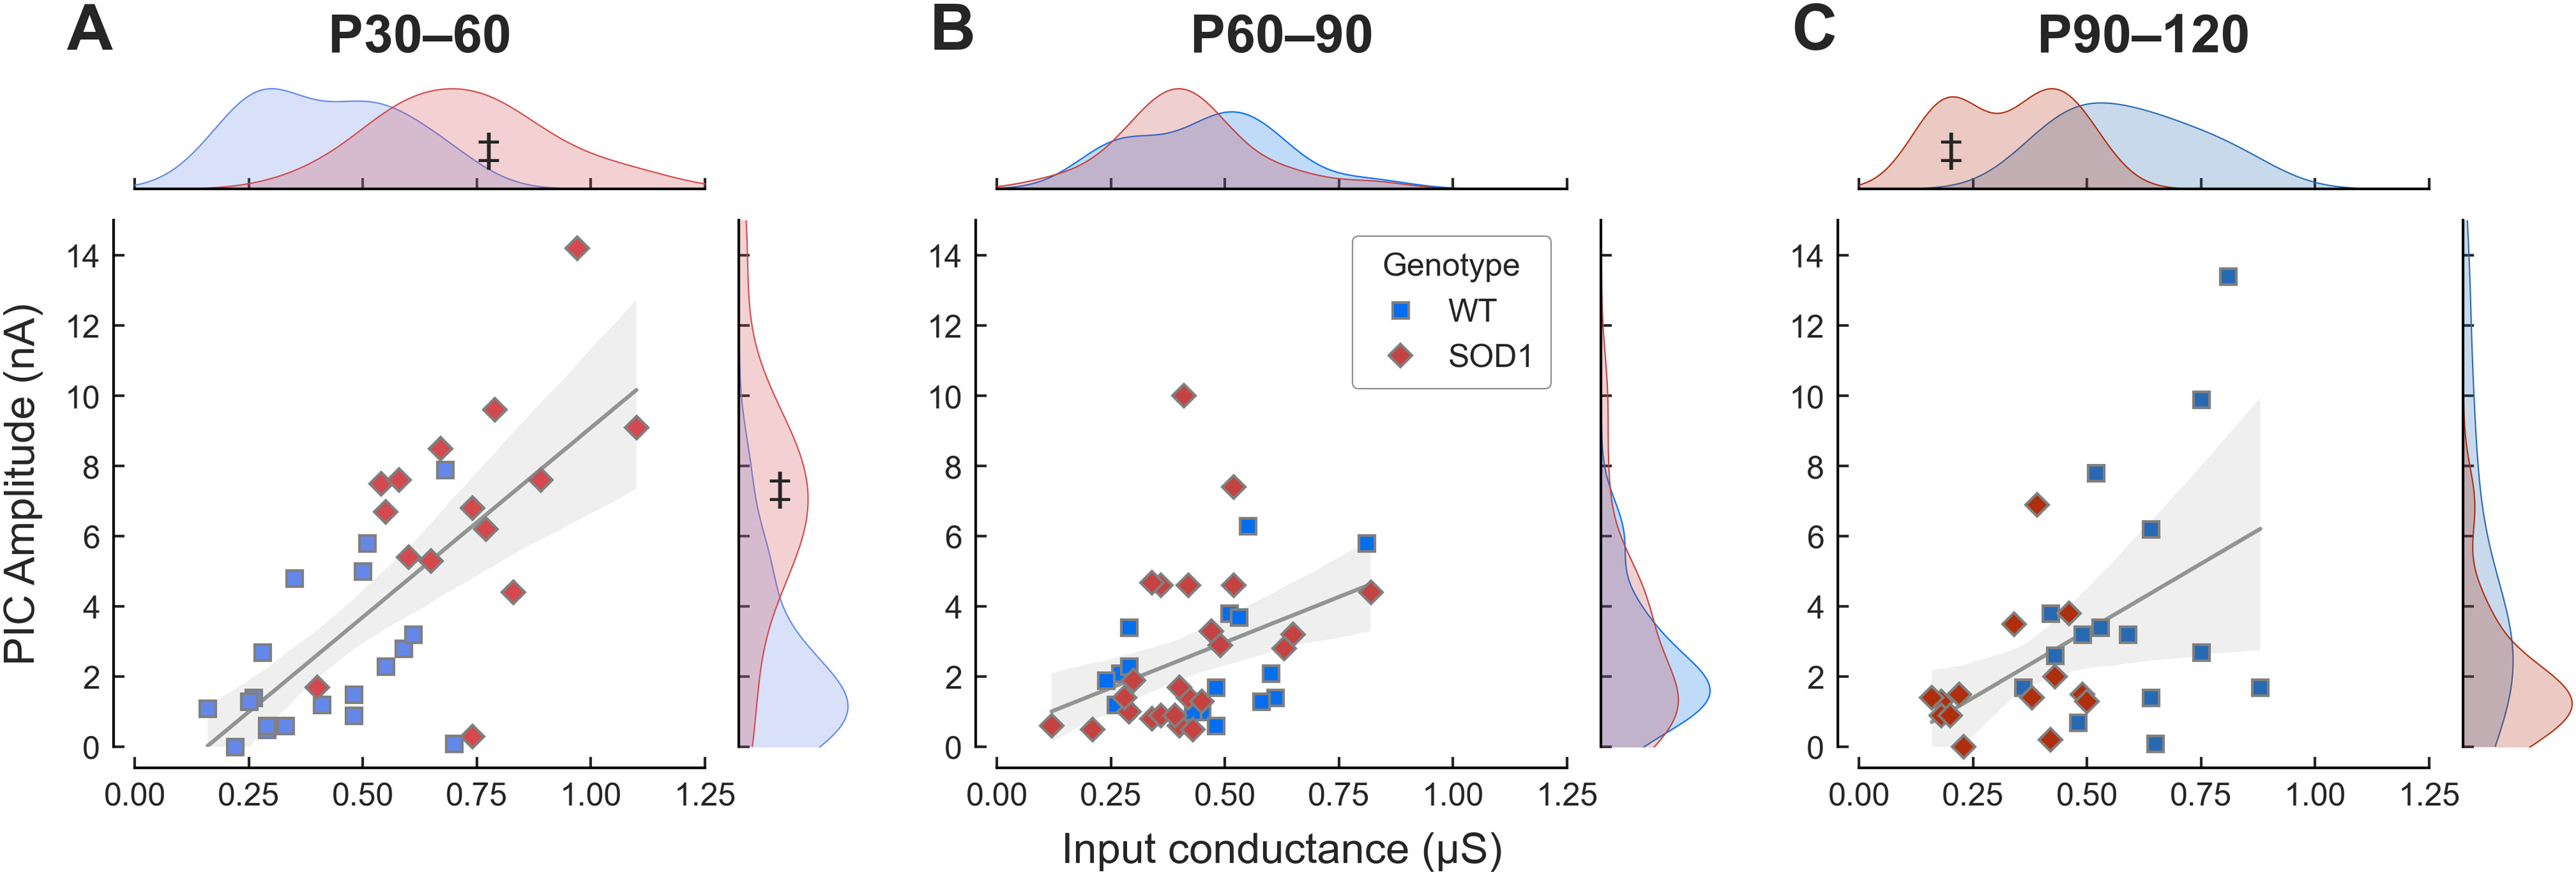
Some motoneurons exhibit properties outside of the normal range. A, Plot of the PIC amplitude versus the input conductance of young adult motoneurons (P30–P60) in WT (blue squares) and mSOD1 (red diamonds) animals. The gray line is the best linear fit ± 95%CI (shaded area) for both samples. Slope = 7.7 mV 95%CI[2.6–12.7], r2 = 0.55 (p = 0.004). The marginal plots indicate the kernel density estimation of the distributions of the values in the two populations. The ‡ symbol points to the fraction of the mSOD1 population that is outside the range of the WT population. B, Same as A for the presymptomatic age range P60–P90. Slope = 5.4 mV 95%CI[1.1–9.8], r2 = 0.15 (p = 0.016). C, Same as A for the symptomatic age range P90–P120. Slope = 7.0 mV 95%CI[−0.8–14.9], r2 = 0.23 (p = 0.078).