. 2021 Mar 30;10:e63026. doi: 10.7554/eLife.63026

Figure 1. All-trans retinoic acid (atRA) induces plasticity of excitatory synapses in human cortical slices.

(A) A representative human cortical slice stained for NeuN. Scale bar = 200 µm. (B) Recorded and post hoc-labeled superficial (layer 2/3) pyramidal neuron. Scale bar = 100 µm. (C) Sample traces of input/output-curves of cortical neurons from atRA- (1 µM, 6–10 hr) and vehicle-only-treated slices (responses to −100 pA and +350 pA current injection illustrated). Action potential frequency of human neocortical neurons from atRA- and vehicle-only-treated slices (ncontrol = 38 cells, natRA = 33 cells in six samples each; RM two-way ANOVA followed by Sidak’s multiple comparisons). (D, E) Passive membrane properties, that is, resting membrane potential (D) and input resistance (E) from atRA- and vehicle-only-treated neurons (ncontrol = 43 cells, natRA = 33 cells in six samples each; Mann–Whitney test). (F, G) Sample traces and group data of AMPA receptor-mediated spontaneous excitatory postsynaptic currents (sEPSCs; ncontrol = 44 cells, natRA = 33 cells in six samples each; Mann–Whitney test, U = 454 for sEPSC amplitude analysis, p=0.12 for sEPSC frequency). Individual data points are indicated by gray dots. Values represent mean ± s.e.m. (ns, non-significant difference, **p<0.01).

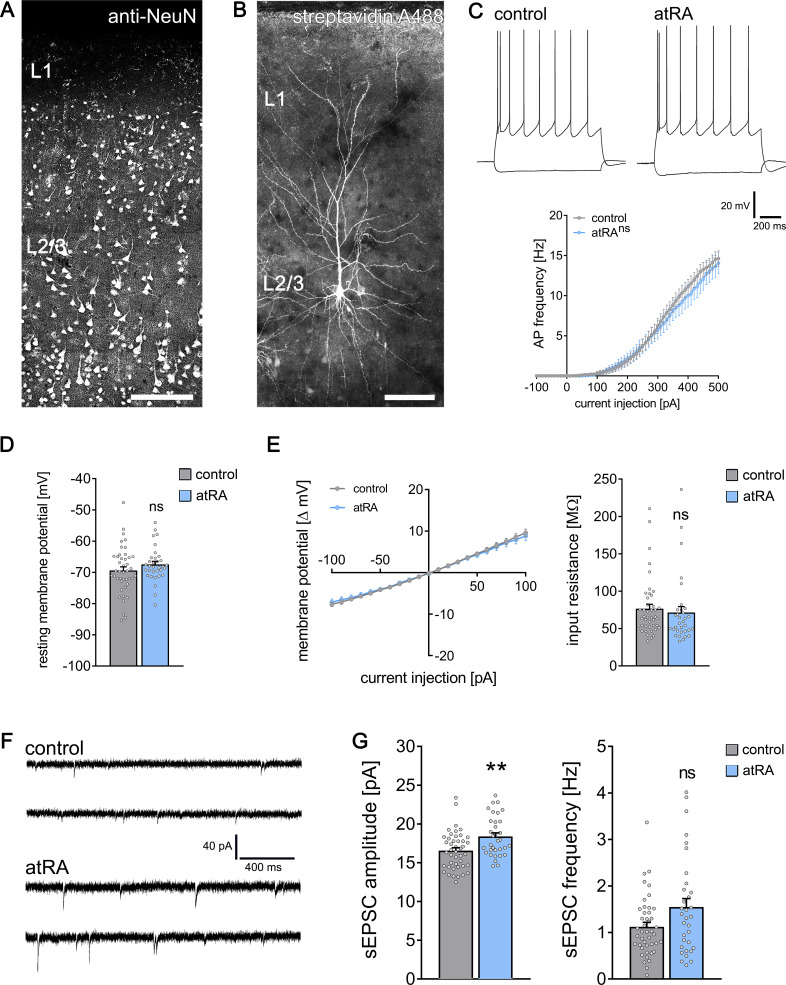
Figure 1.

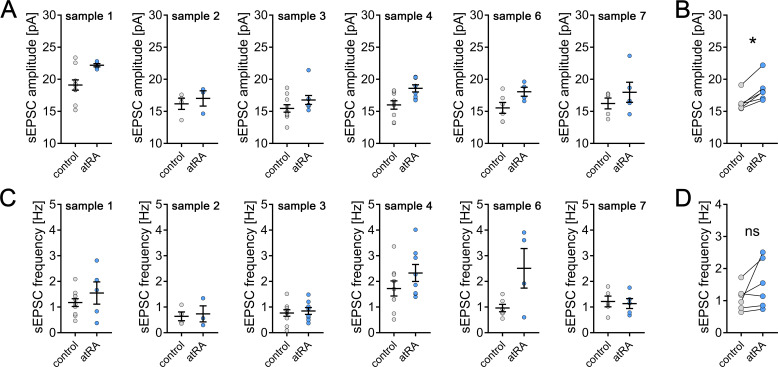
Figure 1—figure supplement 1. All-trans retinoic acid (atRA) induces excitatory synaptic strengthening in human superficial (layer 2/3) pyramidal neurons – an in-sample control analysis.

Figure 1—figure supplement 1.

(A) A total amount of eight human neocortical samples were collected for this study, while cortical slices from six samples were included in this dataset. In each sample, acute cortical slices were randomly assigned to the atRA- or vehicle-only-treated group. In every sample, an increase in sEPSC amplitude can be observed (ncontrol = 44 cells, natRA = 33 cells in six samples each; sample 1: ncontrol = 10 cells, natRA = 5 cells (one cell excluded from further analysis with 38.4 pA/6.5 Hz sEPSC amplitude/frequency, respectively); sample 2: ncontrol = 4 cells, natRA = 3 cells; sample 3: ncontrol = 10 cells, natRA = 8 cells; sample 4: ncontrol = 9 cells, natRA = 8 cells; sample 6: ncontrol = 6 cells, natRA = 4 cells; sample 7: ncontrol = 5 cells, natRA = 5 cells). (B) Paired statistical analysis of mean sEPSC amplitude of atRA-treated slices and their respective in-sample vehicle-only-treated slices reveals a significant increase in sEPSC amplitude following atRA treatment (n = 6 samples; Wilcoxon matched-pairs signed-rank test). (C, D) Analysis of sEPSC frequency with a paired statistical approach does not reveal a significant increase in sEPSC frequency upon atRA treatment. Individual data points are indicated by gray or blue dots, respectively. Values represent mean ± s.e.m. (ns, non-significant difference, *p<0.05).