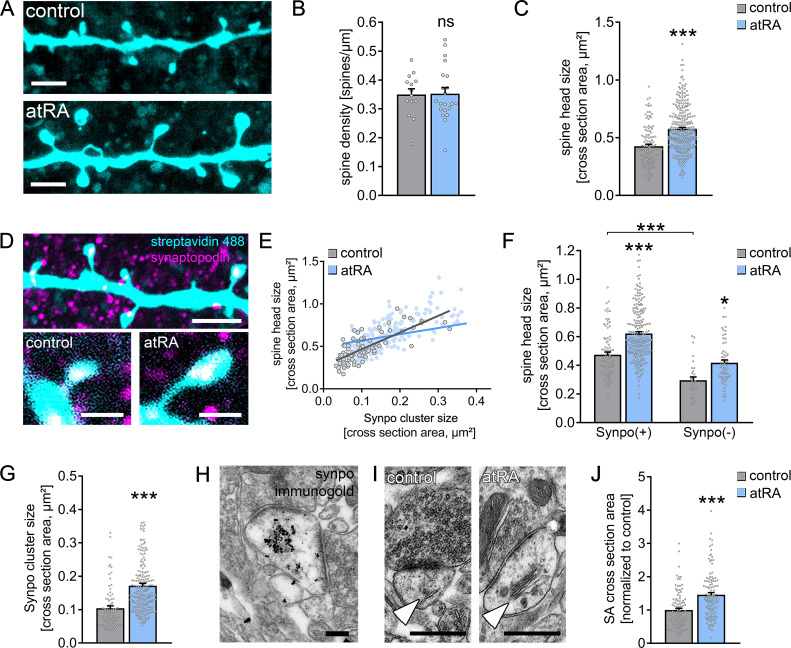
Figure 2. All-trans retinoic acid (atRA) induces dendritic spine plasticity in human cortical slices.
(A) Example of dendritic segments of post hoc-labeled superficial (layer 2/3) pyramidal neurons in atRA- (1 µM, 6–10 hr) and vehicle-only-treated slices. Scale bars = 3 µm. (B, C) Group data for spine densities (ncontrol = 14 dendritic segments, natRA = 21 dendritic segments from three samples each; Mann–Whitney test) and spine head sizes (ncontrol = 115 dendritic spines from 14 dendritic segments, natRA = 267 from 21 dendritic segments, three samples each; Mann–Whitney test, U = 8653). (D) Representative images of synaptopodin (Synpo) stained dendritic segments. Scale bar (upper panel) = 5 µm, scale bars (lower panels) = 1 µm. (E–G) Correlation of synaptopodin cluster size and spine head size (E, ncontrol = 84 dendritic spines, natRA = 208 dendritic spines; Spearman r control = 0.73*** and atRA = 0.69***; three data points outside the axis limits in the atRA-treated group), group data of spine head sizes in synaptopodin-positive and -negative spines (F, synaptopodin-positive spines: ncontrol = 84, natRA = 208; synaptopodin-negative spines: ncontrol = 31, natRA = 59; Kruskal–Wallis test followed by Dunn’s multiple comparisons; one data point outside the axis limits in the atRA-treated group of synaptopodin-positive spines), and synaptopodin cluster sizes in atRA- and vehicle-only-treated slices (G, ncontrol = 84, natRA = 208; Mann–Whitney test, U = 3992; three data points outside the axis limits in the atRA-treated group). (H) Electron micrograph of synaptopodin immunogold-labeled spine apparatus (SA). Scale bar = 250 nm. (I, J) Examples and group data of SA (white arrowheads) cross-sectional areas in atRA- and vehicle-only-treated slices (ncontrol = 103, natRA = 114 from three samples each; values were normalized to the mean cross-section area in the vehicle-only-treated group; Mann–Whitney test, U = 3489). Scale bar = 500 nm. Individual data points are indicated by gray dots. Values represent mean ± s.e.m. (ns, non-significant difference, *p<0.05, ***p<0.001).


