. 2021 Mar 30;10:e63026. doi: 10.7554/eLife.63026

Figure 3. Effects of all-trans retinoic acid (atRA) in cortical slices prepared from synaptopodin-deficient mice.

(A, B) Group data (A) of AMPA receptor-mediated spontaneous excitatory postsynaptic currents (sEPSCs) recorded from superficial (layer 2/3) pyramidal neurons of the dorsomedial prefrontal cortex in slices prepared from wild-type animals (Synpo+/+) and cumulative distribution (B) of sEPSC amplitudes (ncontrol = 58 cells, natRA = 44 cells in seven independent experiments; Mann–Whitney test for column statistics, UsEPSC amplitude = 684; RM two-way ANOVA followed by Sidak’s multiple comparisons for statistical evaluation of cumulative sEPSC amplitude distributions). (C, D) Group data (C) of AMPA receptor-mediated sEPSCs recorded from superficial (layer 2/3) pyramidal neurons of the dorsomedial prefrontal cortex in slices prepared from synaptopodin-deficient mice (Synpo−/−) and cumulative distribution (D) of sEPSC amplitudes (ncontrol = 51 cells, natRA = 49 cells in seven independent experiments; Mann–Whitney test for column statistics and RM two-way ANOVA followed by Sidak’s multiple comparisons for statistical evaluation of cumulative sEPSC amplitude distributions). (E, F) Group data (E) of sEPSC recordings and cumulative distribution (F) of sEPSC amplitudes in cortical slices prepared from transgenic mice expressing GFP-tagged synaptopodin under the control of the Thy1.2 promotor on synaptopodin-deficient genetic background (Thy1-GFP/Synpo+/−x Synpo–/–; ncontrol = 22 cells, natRA = 23 cells in three independent experiments; Mann–Whitney test for column statistics, UsEPSC amplitude = 125; RM two-way ANOVA followed by Sidak’s multiple comparisons for statistical evaluation of cumulative sEPSC amplitude distributions). Individual data points are indicated by gray dots. Values represent mean ± s.e.m. (ns, non-significant difference, ***p<0.001, **p<0.01).

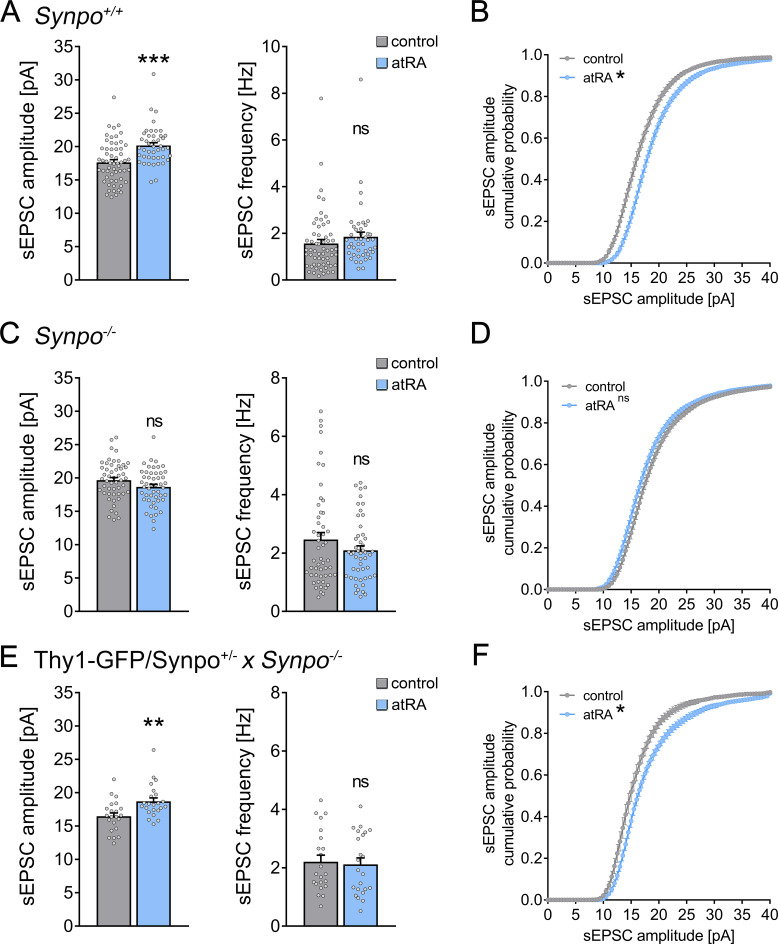
Figure 3.

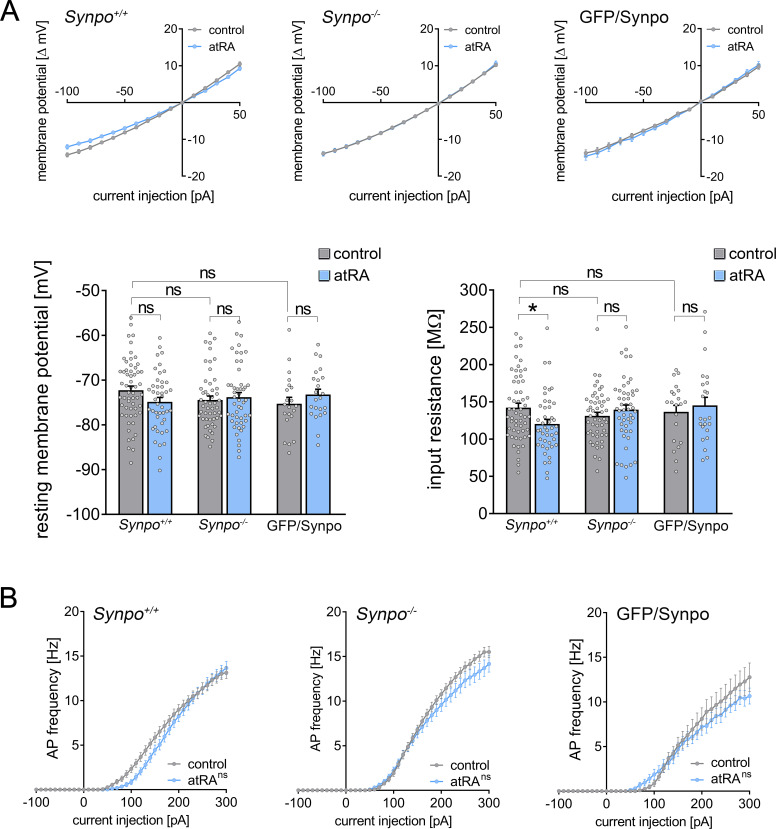
Figure 3—figure supplement 1. Analysis of intrinsic cellular properties from superficial pyramidal neurons in wild-type and synaptopodin-deficient slices upon atRA treatment.

Figure 3—figure supplement 1.

(A) Input–output curves of superficial pyramidal neurons and group data of the input resistance and the resting membrane potential in wild-type (Synpo+/+) and synaptopodin-deficient slices (Synpo–/–). While the resting membrane potential is not affected in both animal cohorts, the input resistance is significantly decreased in wild type but not synaptopodin-deficient preparations upon atRA treatment. Notably, no significant difference in passive membrane properties can be detected between wild-type and synaptopodin-deficient superficial pyramidal neurons (Synpo+/+: ncontrol = 57 cells, natRA = 44 cells in seven independent experiments; Synpo–/–: ncontrol = 51 cells, natRA = 49 cells in seven independent experiments; Thy1-GFP/Synpo: ncontrol = 21 cells, natRA = 23 cells in three independent experiments Kruskal–Wallis test followed by Dunn’s multiple comparisons). (B) XY-plots of the action potential frequency from the same cells in both animal cohorts. atRA did not elicit changes in AP frequency regardless of the presence of synaptopodin (RM two-way ANOVA followed by Sidak’s multiple comparisons), while synaptopodin-deficient neurons seemed to display higher firing rates upon increasing current injections compared to wild-type neurons. Individual data points are indicated by colored dots. Values represent mean ± s.e.m. (ns, non-significant difference, *p<0.05).
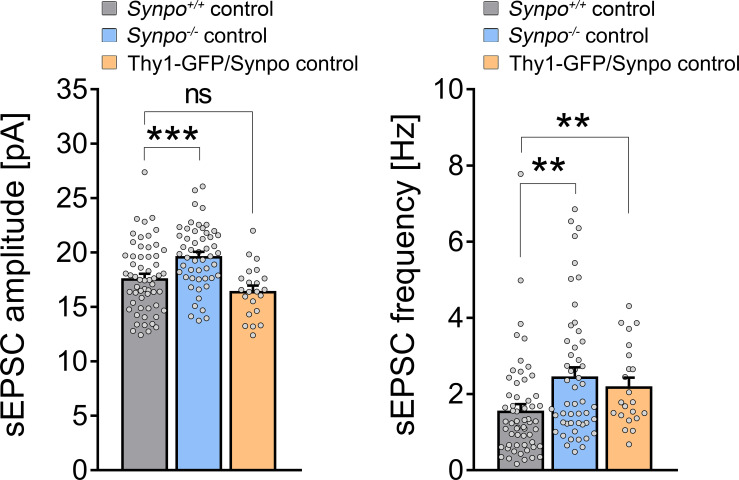
Figure 3—figure supplement 2. Comparison of baseline spontaneous excitatory synaptic transmission in wild-type, synaptopodin-deficient, and transgenic GFP/Synpo superficial pyramidal neurons of the medial prefrontal cortex.

Figure 3—figure supplement 2.

We found a significant higher tone of both sEPSC amplitude and frequency in synaptopodin-deficient preparations under baseline conditions when compared to wild-type preparations. Of note, no difference in sEPSC amplitude but frequency was evident in transgenic GFP/Synpo expressing preparations (Synpo+/+: n = 58 cells, Synpo–/–: n = 51 cells in seven independent experiments each; Thy1-GFP/Synpo: n = 22 cells in three independent experiments; Kruskal–Wallis followed by Dunn’s multiple comparisons). Individual data points are indicated by individual dots. Values represent mean ± s.e.m. (**p<0.01, ***p<0.001; ns, non-significant difference).