. 2021 Mar 30;10:e63026. doi: 10.7554/eLife.63026

Figure 4. All-trans retinoic acid (atRA)-induced strengthening of excitatory synapses depends on mRNA translation, but not gene transcription.

(A, B) Group data (A) of AMPA receptor-mediated spontaneous excitatory postsynaptic currents (sEPSCs) recorded from superficial (layer 2/3) pyramidal neurons of the dorsomedial prefrontal cortex in slices prepared from wild-type mice treated with atRA in the presence of actinomycin D (5 µg/ml) or vehicle-only (vehicle-only: ncontrol = 27 cells, natRA = 21 cells in four independent experiments; actinomycin D: ncontrol = 39 cells, natRA = 37 cells in six independent experiments; Kruskal–Wallis test followed by Dunn’s multiple comparisons). Cumulative distribution (B) of sEPSC amplitudes in actinomycin D co-incubated slices confirms the atRA-induced strengthening of spontaneous excitatory neurotransmission (B; RM two-way ANOVA followed by Sidak’s multiple comparisons). (C, D) Group data (C) of AMPA receptor-mediated sEPSCs recorded from superficial (layer 2/3) pyramidal neurons of the dorsomedial prefrontal cortex in slices prepared from wild-type mice treated with atRA in the presence of anisomycin (10 µM) or vehicle-only (vehicle-only: ncontrol = 27 cells, natRA = 22 cells in four independent experiments; anisomycin: ncontrol = 38 cells, natRA = 40 cells in six independent experiments; Kruskal–Wallis test followed by Dunn’s multiple comparisons). Cumulative distribution (D) of sEPSC amplitudes in anisomycin co-incubated slices confirms that anisomycin blocks atRA-mediated plasticity at excitatory synapses (RM two-way ANOVA followed by Sidak’s multiple comparisons). Individual data points are indicated by gray dots. Values represent mean ± s.e.m. (ns, non-significant difference, *p<0.05, **p<0.01).

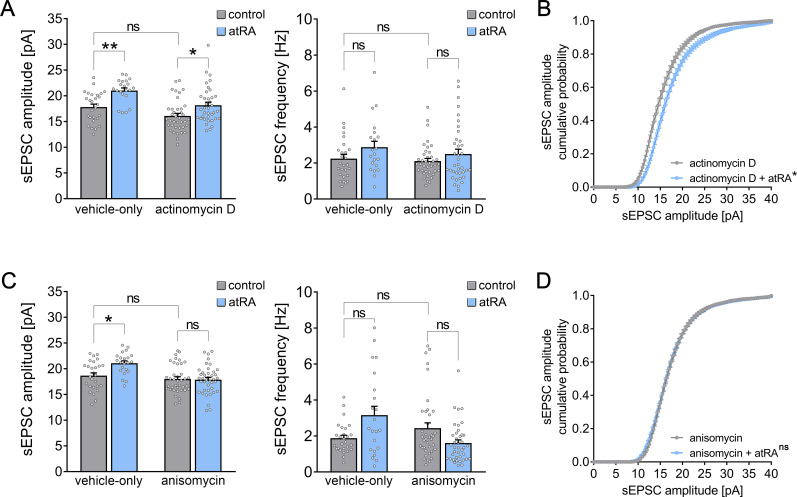
Figure 4.

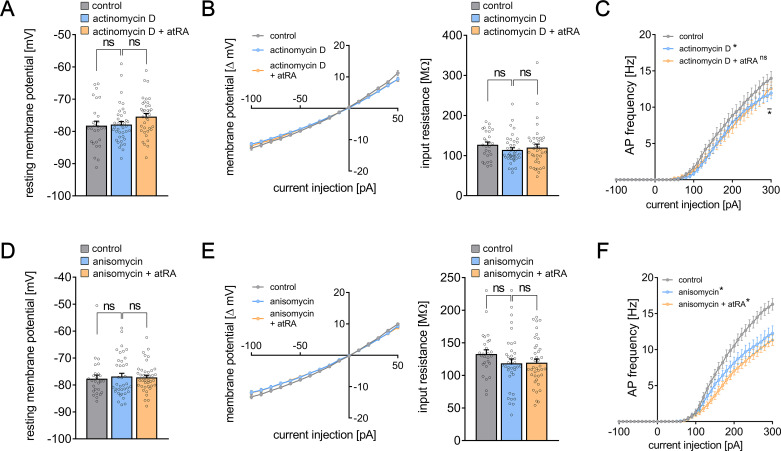
Figure 4—figure supplement 1. Intrinsic cellular properties of superficial pyramidal neurons upon atRA treatment and simultaneous pharmacological inhibition of either gene transcription or mRNA translation.

Figure 4—figure supplement 1.

(A–C) Actinomycin D (5 µg/ml) was used to pharmacologically inhibit gene transcription during the atRA treatment. When co-incubated with actinomycin D, atRA did change neither the resting membrane potential nor the input-output properties, that is, the input resistance of mouse superficial pyramidal neurons in the mPFC (A, B). Furthermore, actinomycin D incubation results in comparable passive membrane properties as reported for vehicle-only-treated slices excluding major toxic effects of actinomycin D in our experimental setting. (C) Assessing action potential frequency upon increasing current injections, we found no difference in the actinomycin D-treated groups upon atRA co-incubation. Notably, a subsidiary but significant decrease in AP frequency was detected between vehicle-only- and actinomycin D-treated slices in higher current injections (ncontrol = 27 cells in four independent experiments; nactinomycin D = 39, nactinomycin D+atRA = 37 cells in seven independent experiments; one cell excluded from action potential frequency analysis in the actinomycin group; Kruskal–Wallis test followed by Dunn’s multiple comparisons; the XY-plot in the AP frequency was statistically evaluated using an RM two-way ANOVA followed by Tukey’s multiple comparisons). (D–F) In another set of experiments, anisomycin (10 µM) was used to block mRNA translation during the atRA treatment. We ruled out major toxic effects of anisomycin since passive membrane properties, that is, the resting membrane potential and the input resistance were not altered when compared to vehicle-only-treated slices (D, E). Nevertheless, anisomycin treatment significantly reduced cellular excitability although a dynamic increase upon increasing current injections was evident (F). When atRA co-incubated with anisomycin, atRA-mediated changes in either passive or active membrane properties became evident (ncontrol = 27 cells in four independent experiments; nanisomycin = 38, nanisomycin+atRA = 40 cells in seven independent experiments; Kruskal–Wallis test followed by Dunn’s multiple comparisons; the XY-plot in the AP frequency was statistically evaluated using an RM two-way ANOVA followed by Tukey’s multiple comparisons). Individual data points are indicated by individual dots. Values represent mean ± s.e.m. (ns, not significant difference; *p<0.05, **p<0.01).