. 2021 Mar 30;10:e60361. doi: 10.7554/eLife.60361

Figure 3. Proinflammatory and prothrombotic factors.

Figure 3.

Blood analysis of patients 1–11 by using Legendplex Panel (Biolegend, CA, USA) of the proinflammatory cytokines Interleukin (IL)−6 (a) and IL-8 (b) as well as tissue plasminogen activator (tPa) (c), P-Selectin (d), D-Dimer (e), Plasminogen activator inhibitor-1 (PAI) (f), soluble (s) CD40ligand(L) (g), Factor IX (h), and the P-selectin glycoprotein ligand 1 (PSGL-1) (i) in pg/ml compared to the mean of five controls (Control, healthy volunteers). Unpaired t-test, Mann-Whitney test p<0.005 ***; p<0.05 **; ns=not significant.

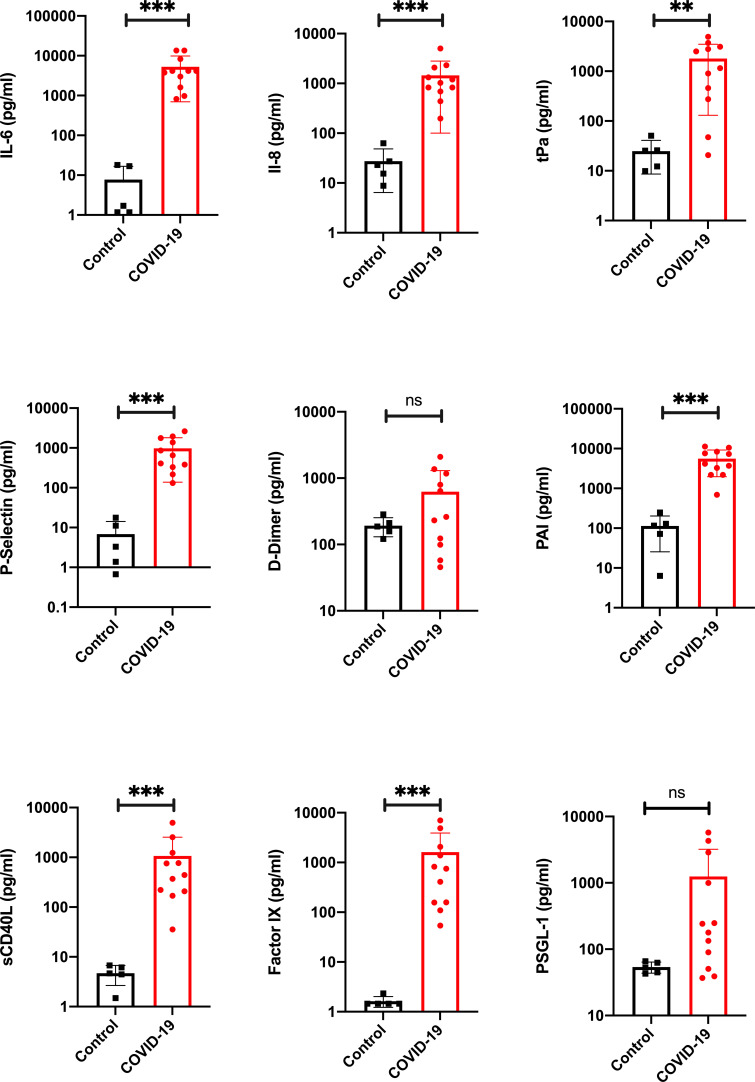
Figure 3—source data 1. Blood analysis of patients 1–11 by using the Legendplex Panel (BioLegend, san Diego, CA, USA) .
Panel (Biolegend, CA, USA) of the proinflammatory cytokines Interleukin (IL)−6 (a) and IL-8 (b) as well as tissue plasminogen activator (tPa) (c), P-Selectin (d), D-Dimer (e), Plasminogen activator inhibitor-1 (PAI) (f), soluble (s) CD40ligand(L) (g), Factor IX (h) and the P-selectin glycoprotein ligand 1 (PSGL-1) (i) in pg/ml compared to the mean of five controls (Control, healthy volunteers). Raw data of the Legendplex software with standard curves.