
Figure 4.
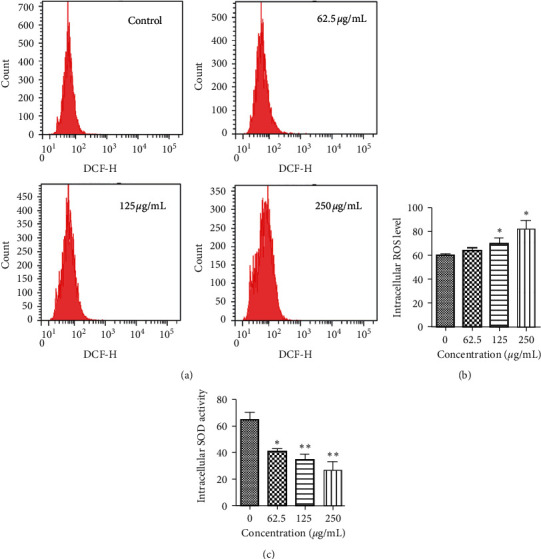
The effect of PBPs on redox balance in HepG2 cells: (a) flow cytometry analysis of intracellular ROS in HepG2 cells after PBPs treatment; (b) the effect of PBPs on intracellular ROS production in HepG2 cells (∗P < 0.05 versus control); (c) the effect of PBPs on intracellular SOD activity in HepG2 cells (∗P < 0.05/ ∗∗P < 0.01 versus control).