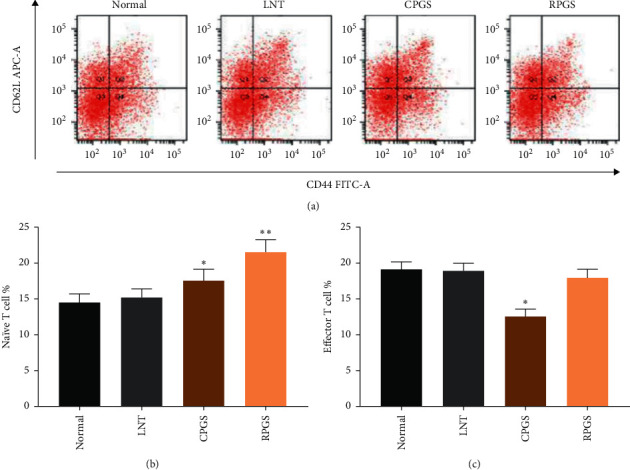
Figure 4.

Effect of CPGS and RPGS on naïve T cells and effector T cells in the thymus, and T cells (a) Representative scatter diagram and quantitative analysis (b, c) for naïve T cells and effector T cells in the thymus. Values were represented as means ± SD (n = 8–10). ∗p < 0.05 and ∗∗p < 0.01.
