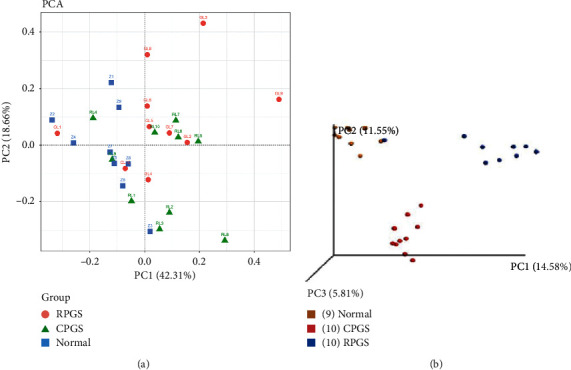
Figure 6.

β-diversity analysis. (a) Principal component analysis (PCA). The percent variation explained by each principal coordinate was indicated on the axes. (b) Principle coordinates analysis (PCoA). The percent variation explained by each principal coordinate was indicated on the axes (n = 8–10).
