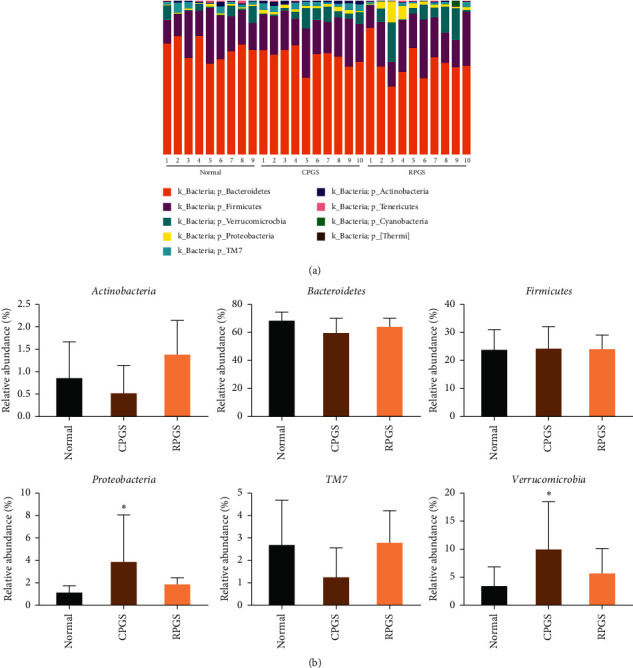
Figure 7.

Taxonomy analysis of microbiota in the fecal at the phylum level. (a) Identified phyla in each sample. (b) Phylum relative abundance comparison (>0.1%). (c) Genera relative abundance comparison (0.1%). Values were represented as means ± SD (n = 8–10). ∗p < 0.05 and ∗∗p < 0.01.
