
FIGURE 1.
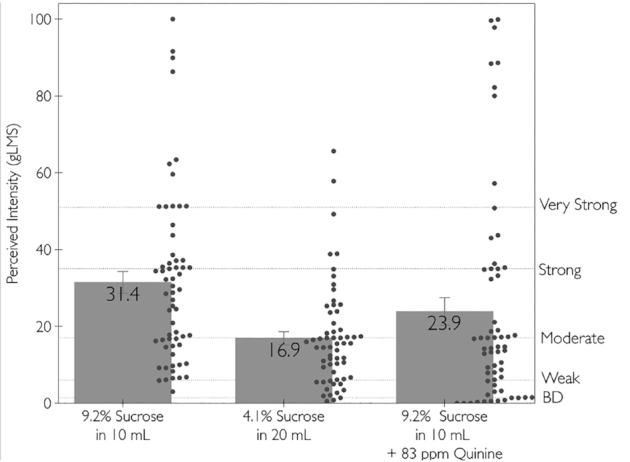
Sweetness ratings of 3 samples that each contain 920 mg of sucrose. Bars are group means and SEs, and dots are the individual ratings. All samples were presented in a counterbalanced Williams design; ratings were obtained using a gLMS by 61 participants. BD, barely detectable; gLMS, general labeled magnitude scale.