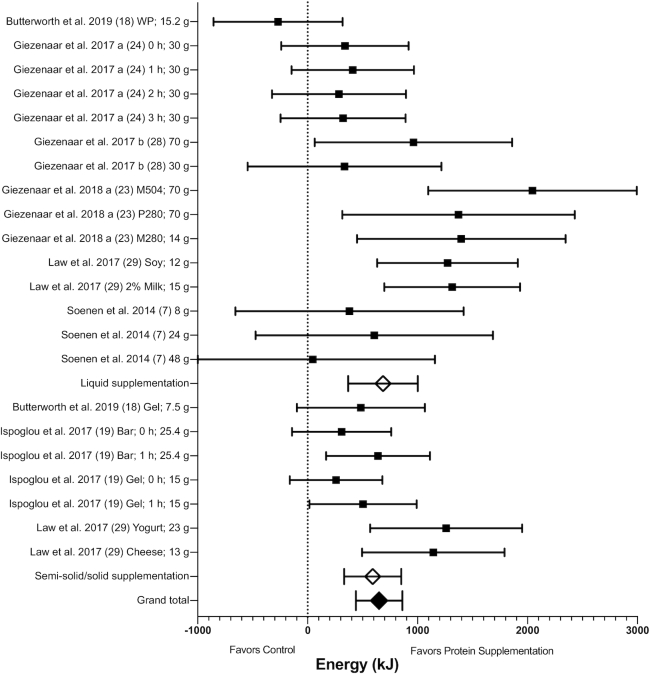
FIGURE 3.
Forest plot of the effects of protein supplementation compared with control on total EI (energy content of the supplement plus energy consumed at an ad libitum test meal) in healthy older adults. Results of random-effects meta-analysis (n = 7 studies, n = 22 comparisons) are shown as MDs with 95% CIs. Overall effect—MD: 649 kJ; 95% CI: 438, 861 kJ; P < 0.00001; I2 = 56%. Subgroup differences are also shown for protein supplementation provided in liquid and semi-solid/solid form. EI increased with supplementation provided in both liquid (MD: 685 kJ; 95% CI: 369, 1002 kJ; P < 0.0001, I2 = 62%) and in semi-solid/solid form (MD: 592 kJ; 95% CI: 332, 852 kJ; P < 0.00001; I2 = 42%), with no subgroup difference (P = 0.66). EI, energy intake; MD, mean difference; M280, mixed macronutrient 280 kcal (1172 kJ); M504, mixed macronutrient 504 kcal (2109 kJ); P280, whey protein 280 kcal (1172 kJ); WP, whey protein.

